Steemit crypto academy // season 3 week 8 // homework post for (@asaj)
QUESTION 1
In your own words define the random index and explain how it is calculated
The Random Index Indicator and how it is calculated
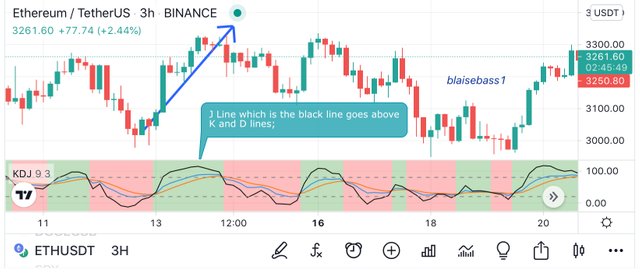
The KDJ indicator is a technical indicator which is used by traders in analysing and predicting trend change in various assets. The KDJ indicator was derived from the Stochastic indicator; and with this derivative it has a little difference from that of the stochastic by addition of an extra line call the J line which is the black line.
To add, the random index indicator is a technical tool which is used to compare a security price movement to the random movements. This determines if the prices is overbought or oversold or to say if the prices of the asset is in a significant trend. Also, we can use the random index to generate trade signals, the trade signals are normally based on the strength of the underlying price of the trend.
The KDJ indicator is made up of 3 lines which are the K, the D and J lines, the J line as mentioned above is the recently added line with the colour of black as default and the K and the D lines red and blue respectively.
A value above the 80 level indicates an overbought and a value the below 20 indicates an oversold. The J line then represents the divergence of the %D from the %K
Lets Calculations the KDJ
We begin by calculating the RSV value of the periods which will be in n days, weeks etc
n-day RSV = (closing price on n’th day – lowest price in n days) / (highway price in n days – lowest price in n days)
calculating the D and K Values
K value of the day = 2/3 x K value of the previous day + 1/3 x RSV of the day
D value of the day = 2/3 x K value of the previous day + 1 / 3 x K value of the day
When we have no k and d values of the previous day, we can use 50.
calculating the J value
J value = 3 x K value of the day – 2 x D value of the day.
lets take an example of the KD line as 9 days period
9 – day RSV = (c – l9) x (h9 – l9) x 100
K = 2/3 x day 8K + 1/3 day 9 RSV
D = 2/3 x day 8D + 1/3 x day 9K
J = 3 x day 9K – 2 x day 9D.

QUESTION 2
Is the random index reliable? Explain
Reliability of the KDJ indicator
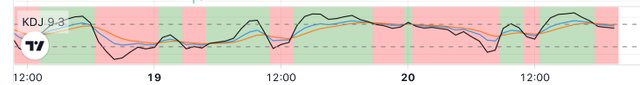
The KDJ indicator shows potential overbought and oversold regions and also gives signals when we have the convergence of the lines as well as the background of the indicator indicating the trend of the market. Shows signals when we have the convergence of its lines.
When the lines are above the 80% level, it indicates an overbought and when the lines are below the 20% level it indicates an oversold, and with this oversold, indications we are therefore supposed to enter a buy order and sell order for overbought.
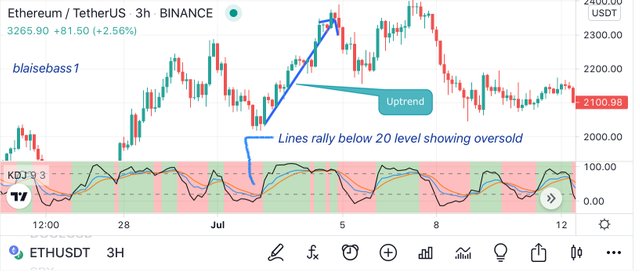
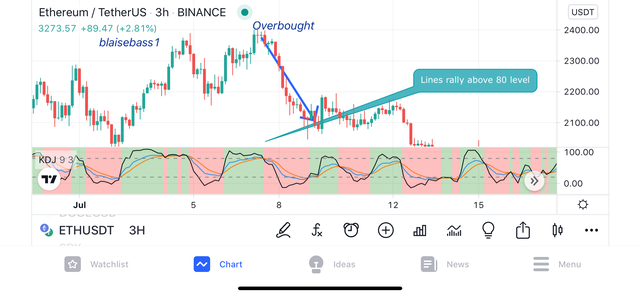
As said above when we have a green background in the indicator section it indicates an uptrend and when we have a red background it indicates a downtrend.

QUESTION 3
How is the random index added to a chat and are the recommended parameters
Adding the KDJ Indicator to a chart
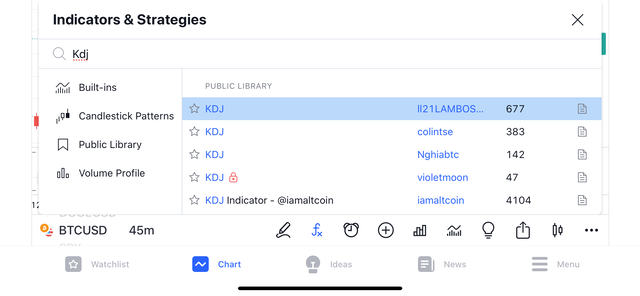
Step 1
We log into the trading view platform which I have already installed on my device and click on the indicator tab
Step 2
We then search and click on the KDJ indicator
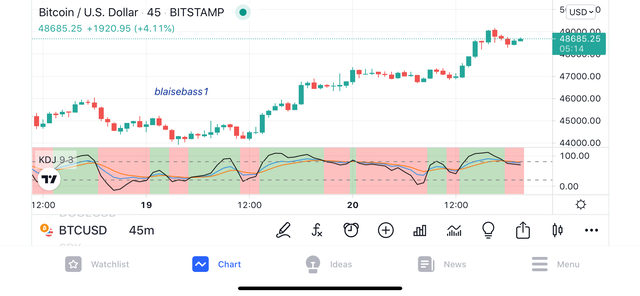
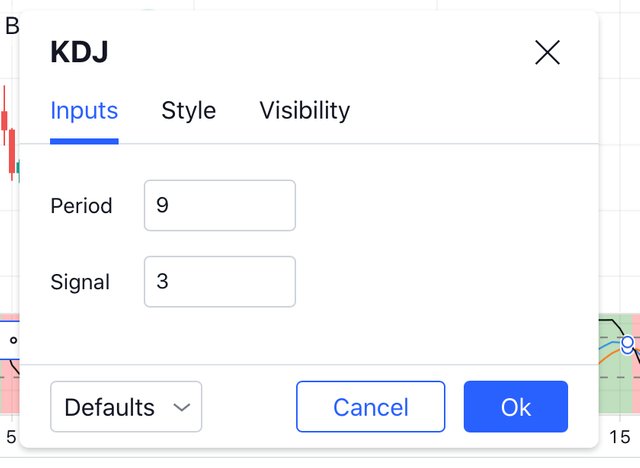
Default Settings of the KDJ Indicator
The defaults settings should be the best settings of the KDJ indicator as I perceive. We can see the default settings as shown below.

QUESTION 4
Differentiate between KDJ, ADX, ATR
The difference between the KDJ, ADX and the ATR
- The KDJ indicator shows the price direction, while the ADX and ATR does not indicates the price direction
- The KDJ with indicator can be used with other indicators such as the ADX and the ATR . While the ADX and ATR can be used with moving averages.
- The KDJ indicator normally has 3 lines which are the K, the D and the J lines and it is used to determine when an asset is overbought or oversold by determining oversold and overbought positions in the 80 and 20 levels, meanwhile the ADX and the ATR has just a single line each
- The KDJ line determines if an asset is overbought or oversold while the ADX uses its values to measure the strength and the ATR measures market volatility.
- The KDJ indicator has a characteristic of indicating the trend by showing dead and golden fork signals with its crosses, while the ADX uses its values to show trend, and the ATR determines the market according to the highest and lowest prices values

QUESTION 5
Use the signals of the random index to buy and sell any two cryptocurrencies.
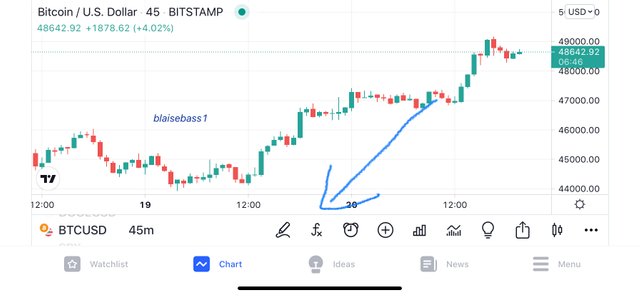
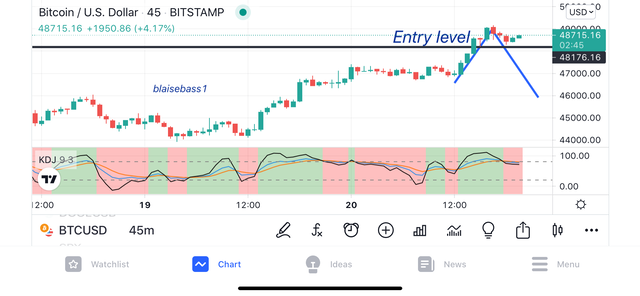
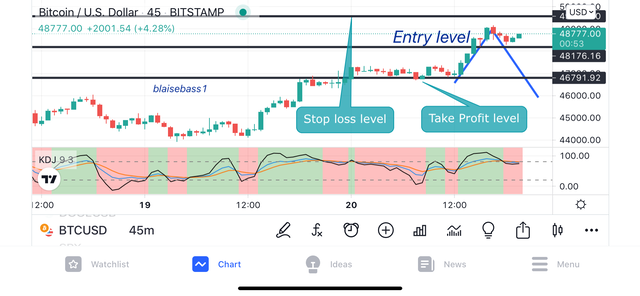
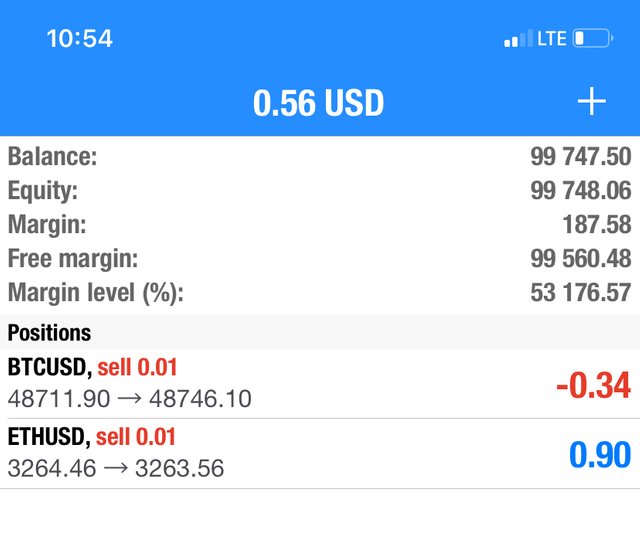
Using the Random Index to Sell the btc/usd
Trade Entry
I will be using 3 ways to get signals from the KDJ indicator as mentioned above.
- To begin, i watch closely the current trend of the btc/usd pair. And as soon as the background changes its colour, it means there have been a change of trend
- I then confirmed this when the J line rallies below the K and the D lines
- I then finalise the confirmation with lines crossing the 80% level.
- With all these confirmations, I enter my SELL ORDER
Trade Exit
Trade exit is setting my suitable stop loss and take profit levels
- My stop loss will be some 30 pips from the trade entry
- I will then use the stop loss level in calculating the take profit by using a risk to reward ratio of 1:1
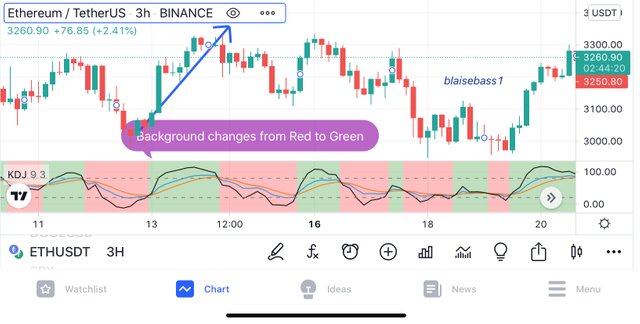
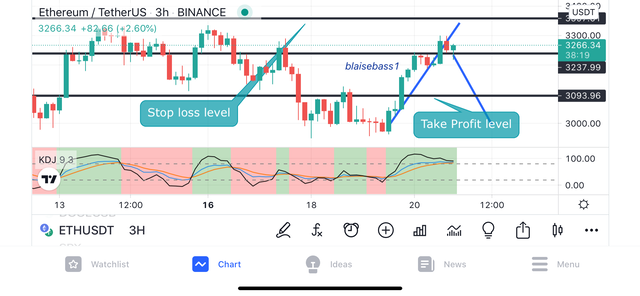
Using the Random Index to Sell the eth/used
Trade Entry
I will be using 3 ways to get signals from the KDJ indicator as mentioned above.
- To begin, i watch closely the current trend of the dode/usd pair. And as soon as the background changes its colour, it means there have been a change of trend
- I then confirmed this when the J line rallies below the K and the D lines
- I then finalise the confirmation with lines crossing the 80% level.
- With all these confirmations, I enter my BUY ORDER
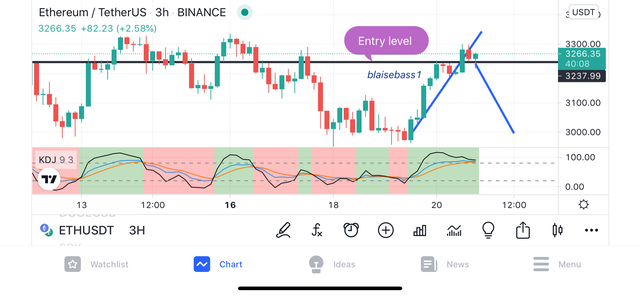
Trade Exit
Trade exit is setting my suitable stop loss and take profit levels
- My stop loss will be some 30 pips from the trade entry
- I will then use the stop loss level in calculating the take profit by using a risk to reward ratio of 1:1
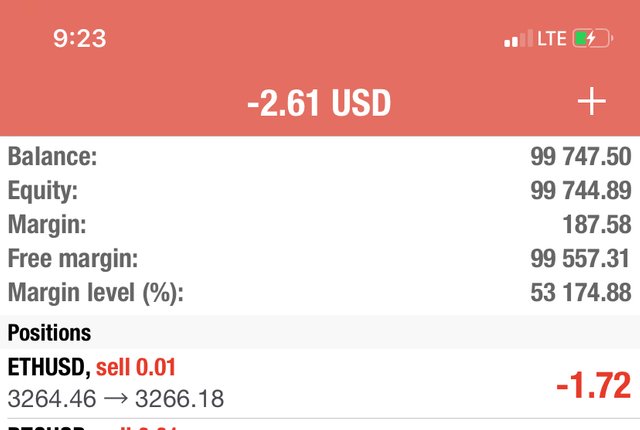
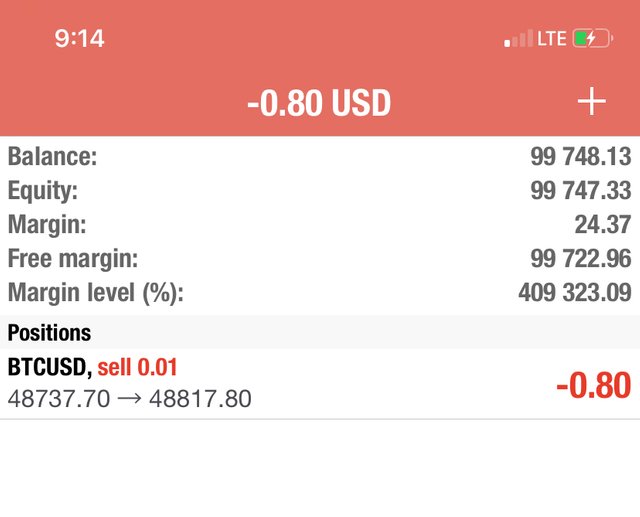
Running trades
Conclusion
With all these, we can see the reliability of the KDJ indicator especially with the addition of the J line from the previous two lines in the Stochatic indicator. Also a great feature in the KDJ indicator is the background. The change in the colour of the background provides a rather quicker view when trading.
CC : @asaj
Hi @blaisebass1, thanks for performing the above task the eighth week of Steemit Crypto Academy Season 3. The time and effort put into this work is appreciated. Hence, you have scored 6 out of 10. Here are the details:
Remarks
You have demonstrated a good understanding of the topic. You have performed the assigned task excellently. However, your answer to task 5 could have been better if you had analysed two coins with clears charts providing the buy and sell signals as well as a screenshot of your demo account summary. Also, you did not provide the level of details we look out for in the academy.
Thank you very much sir