[Trading strategy with RSI and ICHIMOKU]- Steemit Crypto Academy S6/W2- Homework post for Professor @abdu.navi03 by @biladar113
Designed by @bilaldar113 Using Post Maker

Greetings everyone!
Welcome to the second week of the much-awaited season 6. I’m overwhelmed by the efforts of the professors that they are putting into this community to teach us about cryptocurrencies. My utmost appreciation goes to @abdu.navi03 as he has explained an effective trading strategy in the latest lecture through RSI and ICHIMOKU. I will demonstrate my understanding of this strategy in my homework. So, let’s get started:

1-Put your understanding into words about the RSI+ichimoku strategy
1-Put your understanding into words about the RSI+ichimoku strategy
There are tons of trading strategies that are done with the help of technical indicators like MA, stochastic RSI, MACD, and many others. Traders prefer strategies based on their trading style and win rate. So, there are a few strategies that can provide an exceptional risk to reward ratio and RSI + Ichimoku strategy is one of them.
These 2 indicators are combined to make find a perfect entry and exit point. These indicators individually don’t provide a great signal due to which they are both used at once, you can easily get to learn about the traders’ action in the market and the prior trend that the specific cryptocurrency will adapt. So, it has become one of the recommended strategies which are great for swing and intraday trading.
2-Explain the flaws of RSI and Ichimoku cloud when worked individually
2-Explain the flaws of RSI and Ichimoku cloud when worked individually
It is said that the technical indicators lag when it comes to providing signals. The reason is that they are based on past data, not the latest price movement due to which accurate signals can’t be produced. This is the very own reason due to which 2 indicators RSI and Ichimoku are used at once in the strategy that we are discussing today.
However, using both indicators separately won’t be a wise decision as there are some flaws that we will discuss deliberately.
RSI Flaws
RSI Flaws
RSI is used to get an insight into the strength of bulls and bears in the market through an oscillating line that ranged between 0 and 100. If it is between 0 and 30, then it means that the price will make a bullish move and the same goes for the bearish trend which will be commenced once the lines touch the range of 70 and 100.
However, it doesn’t work when the market is moving in a strong trend as the price and indicator make an opposite signal. Those traders who are not familiar with this flaw open trade and end up hitting the stop loss. Another issue is that it doesn’t represent how much volume is in the asset due to which one can’t open a trade.
Ichimoku Cloud Flaws
Ichimoku Cloud Flaws
Ichimoku Cloud consists of 5 moving averages which provide great details like support, resistance, trend reversal, and other things about the price action. But just like any other indicator, it also lags when it’s about providing trading signals. So, one can barely predict the upcoming trend through this indicator. Plus, when the market moves between a range, the support and resistance that it shows are barely followed and broken several times by the price.
3-Explain trend identification by using this strategy (screenshots are required)
3-Explain trend identification by using this strategy (screenshots are required)
RSI + Ichimoku strategy can help you to identify the uptrend and downtrend in a very easy manner. All you need is to apply both indicators and lookout for a few things that I will explain with a screenshot from the market.
I will demonstrate how an uptrend can be observed by analyzing the 1-hour chart pattern of DOT/USDT. The first thing is to observe the RSI and wait for it to make a double top which is the signal of downtrend retracement. Now you might be thinking about how it can help with finding an uptrend but the reason is that there is a huge buying pressure where the double top is formed which can help the price to skyrocket.
As for the Ichimoku cloud, we have to wait for it to make a buy signal by breaking the cloud. You can see from the mentioned chart that both indicators was adding a huge confluence to the uptrend and gave us an ultimate signal to open a long position.
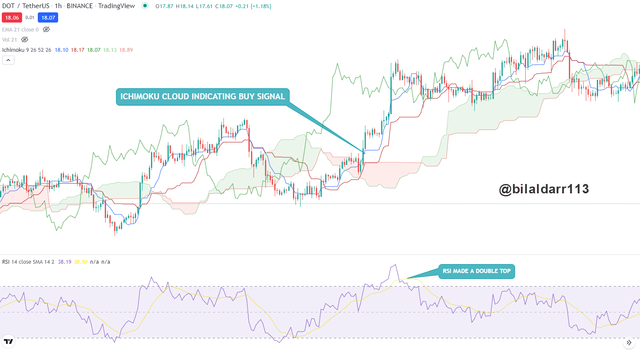
In the same way, we can predict the downtrend with the help of this amazing strategy.
4-Explain the usage of MA with this strategy and what lengths can be good regarding this strategy (screenshots required)
4-Explain the usage of MA with this strategy and what lengths can be good regarding this strategy (screenshots required)
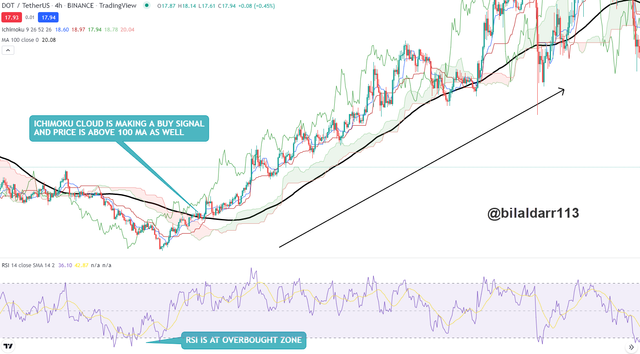
We can use several technical indicators with this strategy so that it can produce much better signals and clear the confusion from the traders’ minds. Plus, the more confluence you add, the more you will be confident in taking the trade and that’s why we can also make use of moving average to get a clear picture of the trend.
I would prefer to use the MA of high length like 100 as one of our indicators Ichimoku cloud already uses small length MA to represent signals. Thus, using 100 MA will show a clear trend and add much more confluence to the trading.
You can observe the below-mentioned chart will show that the RSI is at the overbought zone and Ichimoku cloud is also showing a buy signal. Now, I added the final confluence of the 100 MA which also showed an uptrend. So, I can now open a long position.
5-Explain support and resistance with this strategy (screenshots required)
5-Explain support and resistance with this strategy (screenshots required)
Now you don’t have to open multiple timeframes on the chart and draw support/resistance as this strategy provides strong buying and selling zones. When the market is trending, we will observe Ichimoku cloud and RSI when the market is consolidating.
Let’s take a look at each case with a live explanation:
Trending Market
Trending Market
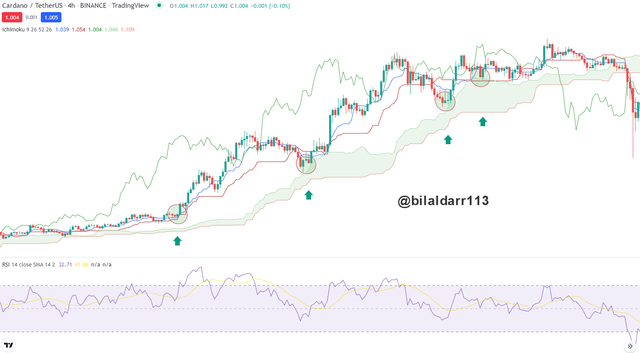
Whether the market is in an uptrend or a downtrend, the Ichimoku cloud will represent accurate support and resistance that will help the intraday traders with the scalping. I will show you how it is formed so that you can also make the most out of it while trading.
I have attached a chart that shows that the green cloud is working as resistant as every time the price touched it, it bounced from that area. In the same way, the red cloud works as a resistance. The gap between the candles and cloud indicates the strength in trend.
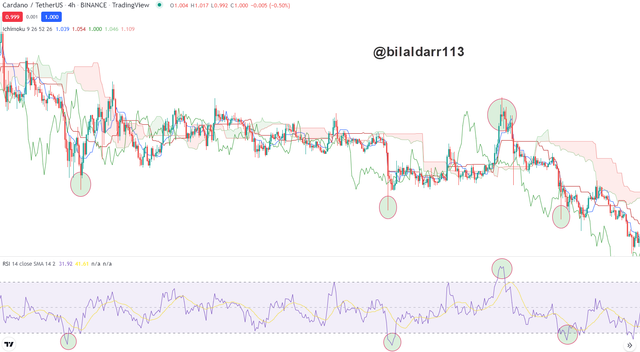
Ranging Market
Ranging Market
When the market is in the consolidation phase, Ichimoku cloud won’t be of any use but we will opt for the RSI which will help us to know about the potential support and resistance.
See from the below-mentioned chart and you can see that the price has always reversed from the point every time the RSI line touched the overbought or oversold zone. I have even marked them on the chart for better understanding.
6-In your opinion, can this strategy be a good strategy for intraday traders?
6-In your opinion, can this strategy be a good strategy for intraday traders?
I believe that this strategy is best for both swing and intraday trading. The reason is that we make use of RSI which helps us to know about the strength of bulls and bears in the market including support and resistance during the ranging market.
As for the Ichimoku cloud, it represents the volume, support, resistance, trend, and volatility. By combing both indicators, it will become a piece of cake to find the best entry and exit points as the indicators will be providing accurate data that are sure to provide profit. However, a trader should be very well familiar with the usage of both indicators including MA to execute the trades professionally.
7-Open two demo trades, one of buying and another one of selling, by using this strategy
7-Open two demo trades, one of buying and another one of selling, by using this strategy
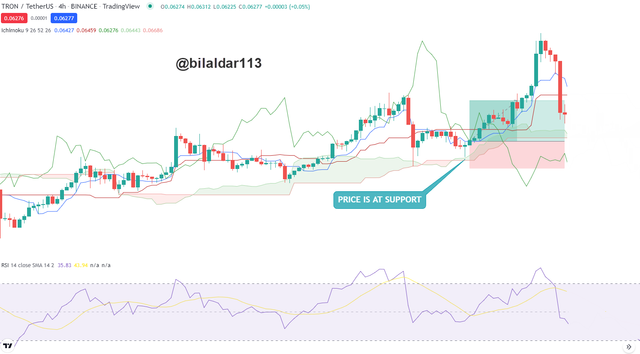
Buy Trade
Buy Trade
For the buying trade using this strategy, I opened the chart pattern of TRON/USDT which showed that the price was at the support and RSI was below 50 which means that I can open a long position with the preferred risk to reward ratio.
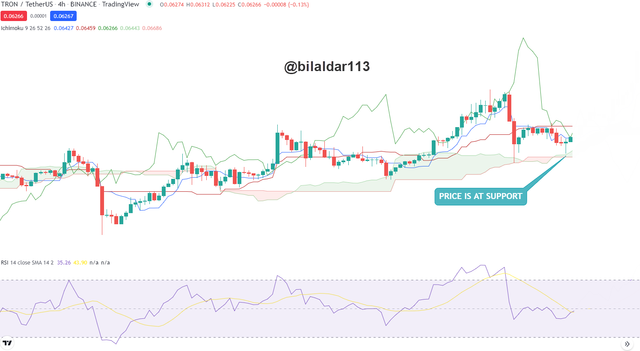
I entered the trade with the RR of 1:5 and you can see that the TP was easily hit-making my setup successful.
Sell Trade
Sell Trade
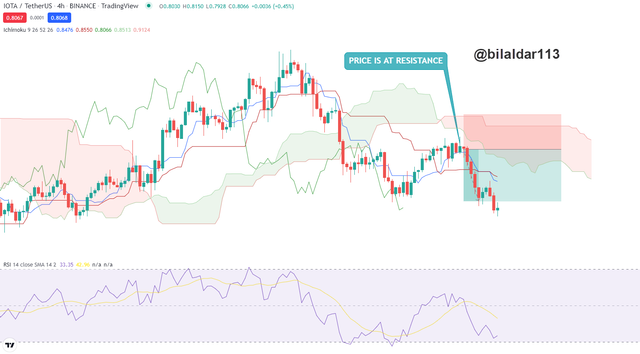
I have demonstrated sell trade on IOTA/USDT which shows that the Ichimoku cloud was red indicating that the price was in a downtrend and at resistance. RSI was also heading to the oversold area which means that I can open a short position accordingly.
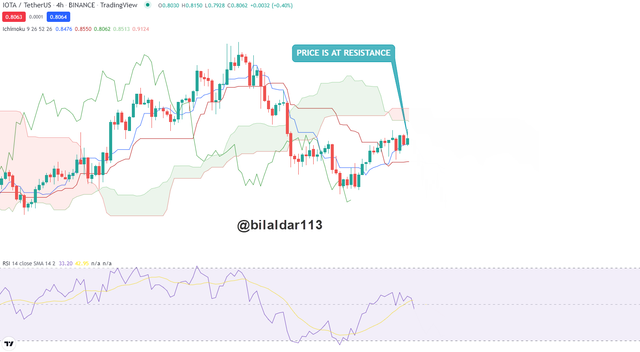
After a series of hours, the TP which was according to the RR of 1:5 was hit.
Conclusion
Conclusion
I would like to sum up my homework and state that the RSI and Ichimoku cloud can help a trader to make a good fortune if the entry and exit strategies are properly followed. Plus, I will be able to demonstrate the effectiveness of this strategy on paper trading which actually showed a great result.

Thanks For Visiting My Post
Cc: @abdu.navi03
Sort: Trending
Loading...