Crypto Academy Season 5 Week 4- Trading Using Rectangle Pattern - Homework Post for @sachin08
Designed by @bilaldar113 Using Post Maker

Hey Everyone!
I hope you guys are doing well. In the 4th week of the crypto academy, I had the privilege to learn about rectangle patterns from professor @sachin08. Prior to that, he taught us about triangle and flag pattern which is equally important as the rectangle. Now, I will share my progress through this homework post.

1. Explain Rectangle Pattern in your own word.
1. Explain Rectangle Pattern in your own word.
There are numerous ways to guess the price action of assets. Chart patterns are widely recommended because they are very easy to identify and give a clear signal of whether the price will start a bullish trend or bearish trend. The rectangle is also a famous pattern that is further divided into 2 categories that are top rectangle and bottom rectangle.
This pattern is very rare in crypto. It is formed after the price makes a strong move in a specific direction and then starts ranging between the support line and resistance line. The price shows that bulls and bears are in a continuous struggle of dominating the market. However, once any of the trendlines is broken, the price will start a strong trend to that direction.
The trader opens a long position when the price breaks the resistance line and puts stop loss below support. That’s the same way to trade when the price breaks the support line. It is the most recommended pattern because it can give a huge profit.
2. How to identify Rectangles. Explain with Screenshots.
2. How to identify Rectangles. Explain with Screenshots.
Rectangles are rare patterns so it will be hectic to find them in the crypto charts. There are some things that are explained by the professor in the course which can make it easy for you to identify them without wasting too much time exploring the charts.
The first thing to consider is the price trend. In order to form a rectangle, the price should be ranging between 2 lines. If the price fails to respect the support and resistance line, then the pattern will be invalidated. Additionally, if you are looking for a rectangle top, then it will be located on the top of the chart and formed after a bullish trend. In the same way, rectangle bottom can be found in the bottom of the chart after a bearish trend.
The next thing to consider is the horizontal lines. The rectangle is made up of 2 lines that are resistance line and support line. The price keeps ranging between these 2 lines and it has to test each line for 2 times. So, when you look for this pattern in the chart, you have to make sure that it has touched the support and resistance line twice. If it doesn’t, then the pattern will be invalidated.
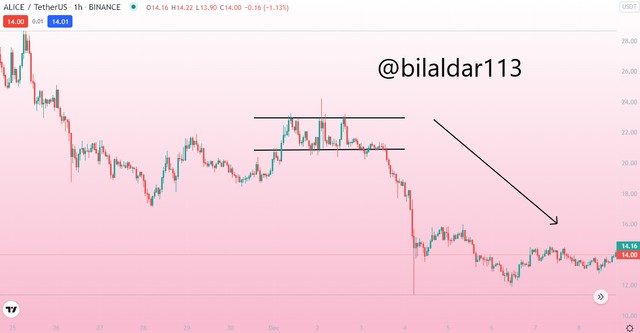
I will show you an example for a better understanding. The price of the following chart started an uptrend which is marked by the arrow. Next, you can see that the price started to range on the top of the market which means that it has formed a rectangle top. Also, the price was respecting the support and resistance which means that pattern is valid.
The top rectangle indicates that the price will go bearish after breaking out and that’s what it did after breaking the support line.
3. Can we use indicators with this pattern to get accurate results? Explain with Screenshots.
3. Can we use indicators with this pattern to get accurate results? Explain with Screenshots.
The indicators and rectangle patterns work side by side. We can find out the future price of a commodity with the help of a rectangle pattern but it is not accurate every time. That’s why we have to use several indicators based on personal choice for more confluence and trade professionally. Using indicators and price action can save us from opening invalid trades.
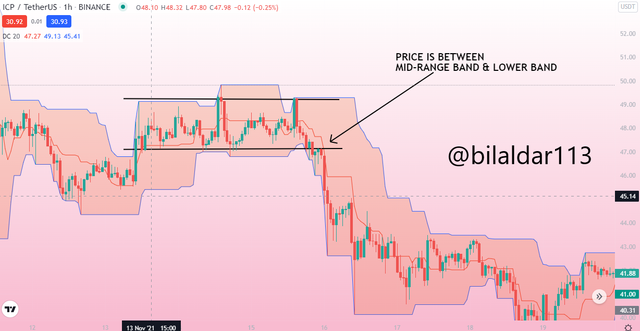
I have mentioned an example. See that rectangle top is formed which means that we can open a short position when it breaks the support line. But using an indicator will confirm if the signal is valid or not, so I used Donchian Channel. The price is ranging between the mid-range and lower-range which means that it is bearish. So, I can short the commodity without any problem.
4. Explain Rectangle Tops and Rectangle Bottoms in your own words with Screenshots of both patterns.
4. Explain Rectangle Tops and Rectangle Bottoms in your own words with Screenshots of both patterns.
Rectangle Tops
Rectangle Tops
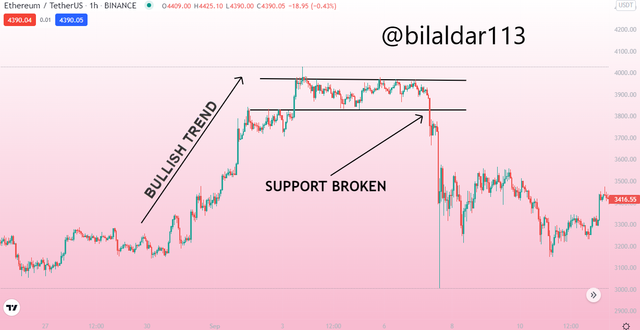
As the professor has explained, the rectangle top is formed when the price makes a bullish move and then consolidates which ends up making the rectangle pattern. It is found at the top of the chart and shows that the price will become bearish after breaking the support line.
This chart is an example of a rectangle top because it is formed on top of the chart and the price has made a strong bullish move prior to the pattern. In addition to that, the price did exactly the same thing that this pattern predict. It started a strong downtrend move after breaking out from the support.
Rectangle Bottom
Rectangle Bottom
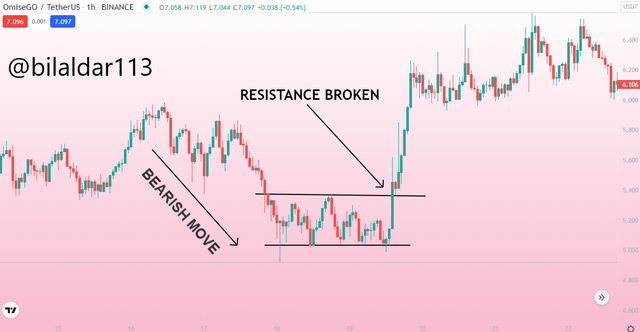
Rectangle bottom can be found on the lower side of the market. It is formed when the price makes a bearish move and starts ranging between 2 lines. The outcome of this pattern is bullish.
The chart shows that price was ranging between support and resistance after a downtrend. It broke the resistance line with great volume and then started a bullish trend.
5. Show full trade setup using this pattern for both trends. ( Entry Point, Take Profit, Stop Loss, Breakout)
5. Show full trade setup using this pattern for both trends. ( Entry Point, Take Profit, Stop Loss, Breakout)
Demo Trade of Rectangle Top
Demo Trade of Rectangle Top
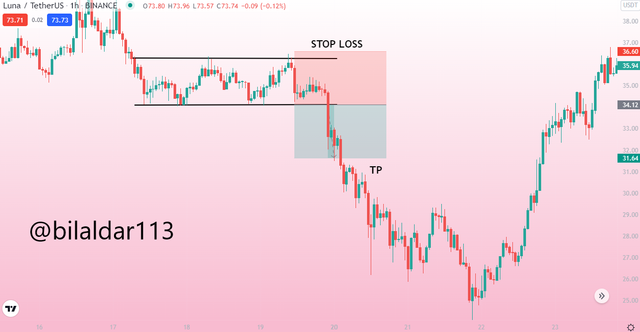
Rectangle tops are formed on the top of the market which means that price will be bearish after breaking the resistance line. You can see the rectangle top on the below chart and the price broke the support line which is the signal to short the commodity. So, I opened a short position with RR of 1:1 and the price went straight to my TP.
Demo Trade of Rectangle Bottom
Demo Trade of Rectangle Bottom
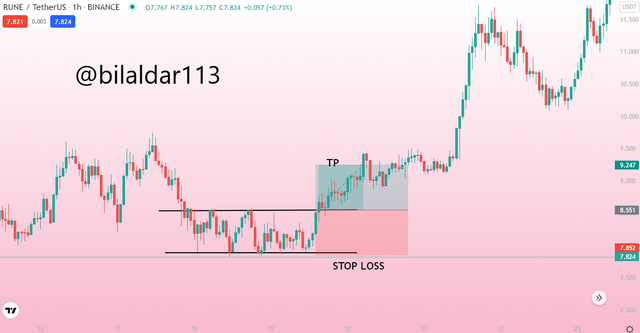
Rectangle bottoms are bullish pattern which is formed after a downtrend. The following chart made a rectangle bottom which means that price will be bullish after breaking the support line. Once it broke the line, I longed the commodity with RR of 1:1 and you can see the price was bullish and hit my TP.
6. Conclusion
6. Conclusion
The conclusion of this homework is that rectangle is an important pattern and traders should know how to trade it. It gives bullish and bearish predictions and if it is identified properly and indicators are used for confluence, then it can give tons of profit. I would like to thank the professor for teaching valuable patterns.

Thanks For Visiting My Post
Cc: @sachin08
Sort: Trending
Loading...