Crypto Academy Season 5 Week 3- “Perfect Entry” Strategy Using Stochastic Oscillator + 200 Simple Moving Average - Homework Post for @lenonmc21

Designed by @bilaldar113 Using Post Maker

Hey Everyone!
I hope you are doing well. From the 3rd week of Steemit Crypto Academy, I have learned one of the best trading strategies from the professor @lenonmc21 called “Perfect Entry”. It is done using 200 simple moving average, stochastic oscillator, and price action. Further, I will explain everything by answering all the questions in detail.

“Theory”
1. Say in your own words what you understand about the Perfect Entry Strategy (Place at least 2 examples on crypto assets)?
1. Say in your own words what you understand about the Perfect Entry Strategy (Place at least 2 examples on crypto assets)?
Perfect Entry is a trading strategy that gives signals to open a long or short position according to the market trend. A few famous technical indicators are used along with price action to find the perfect entry point in the crypto assets.
The foremost element is the market structure. The price has to be in a specific direction like downtrend or uptrend, and we can find out that by drawing structure. Including that, we will be using the 200 Simple Moving Average, which will be working as a support for a bullish trend and resistance for a bearish trend.
Another indicator that we will be using is called a stochastic oscillator. It is used to find out if the commodity is overbought or oversold. It will give confluence to our trade, and the last element is the candlestick which is supposed to have a small body and tiny wicks on above and below the body. After considering all these elements, we will be able to find the perfect entry for trading.
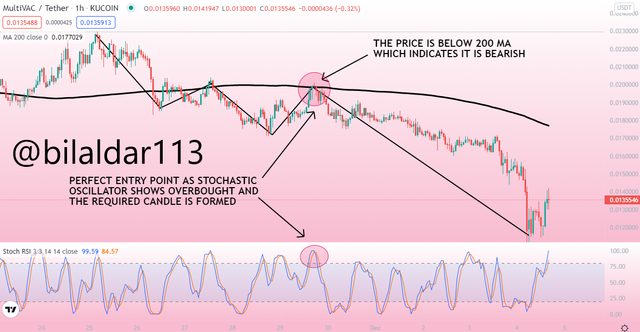
Take a look at the aforementioned chart of MTV/USDT. It is in a downtrend and making lows, and the price is below 200 MA as well. The stochastic indicator is at overbought, which represents that price will retrace. The candle that is required was also formed, which means that we can short the asset as the criteria were fully met for the perfect entry.
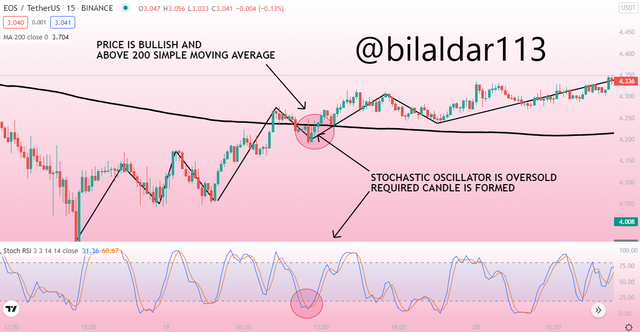
As you can see from the aforementioned chart of EOS/USDT, the asset is in an uptrend and making highs and also going above the 200 MA. The stochastic indicator is between 0 and 20, which means oversold, and the candle with a small body and both side wick is formed, which means that we can open long trade as technicals are giving a perfect entry signal.
2. Explain in your own words what candlestick pattern we should expect to execute a market entry using the Perfect Entry Strategy.
2. Explain in your own words what candlestick pattern we should expect to execute a market entry using the Perfect Entry Strategy.
The professor has deliberately explained in the course that we have to look for such candles that has a small body and wicks on both sides. It will work as a trigger candle for our perfect entry strategy. The reason to choose such candles is that it indicates that there’s no force from bulls and bears. In that case, the candle will indicate that the price is most likely to continue the trend that 200 MA represents.
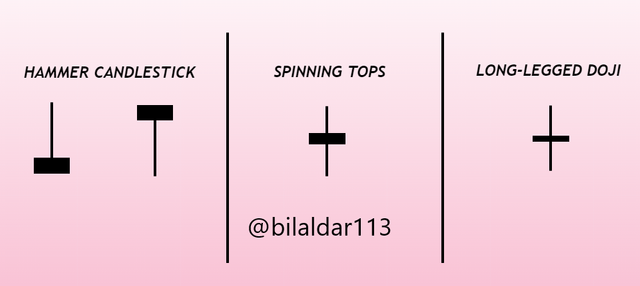
There are several candlesticks’ patterns like shooting start, 3 white soldiers, bullish engulfing, bearish engulfing, gravestone doji, and others. But what truly connects to our strategy is a hammer, spinning tops, and long-legged doji.
Refer to the following image, and you can find the 3 candlesticks that truly apply to our condition. Each of them has a small body and wicks to both sides. These candles also represent that there’s no force from bulls and bears. Therefore, we should be looking for hammers, long-legged dojis, and spinning tops so that we can trade with perfect entry maximum winning rates because these candles play a great role.
3. Explain the trading entry and exit criteria for buy and sell positions in any cryptocurrency of your choice (Share your own screenshots)
3. Explain the trading entry and exit criteria for buy and sell positions in any cryptocurrency of your choice (Share your own screenshots)
In order to trade a perfect entry strategy, it is important that all the required criteria are fulfilled as they combined add confluence and provide the best signal. You can know about the most important criteria from the following sections:
Market Structure:
Market Structure:
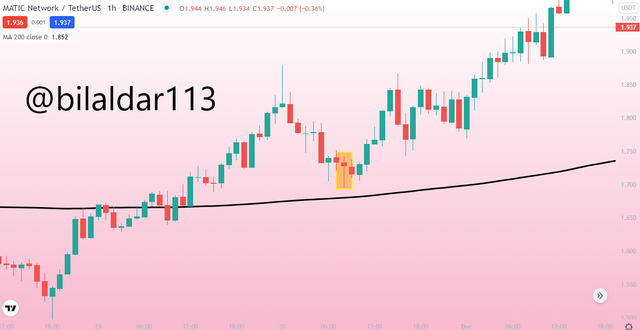
We have to first understand the structure of the market, and it is the most essential part. The price of any asset can be bullish, bearish, or ranging. We have to look for a strong uptrend or downtrend in a commodity and that can be easily done by drawing highs and lows according to the market condition. Plus, 200 MA is also used because it works as a support and resistance and represents the trend of the market. See the following chart, and you can find the price is bullish because it is making higher high, and 200 MA has become support as the price is above the line.
Finding The Perfect Candles:
Finding The Perfect Candles:
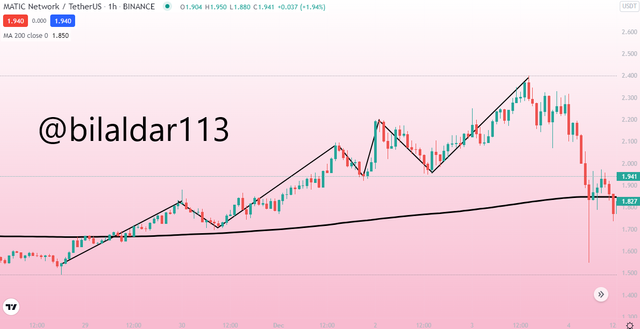
candlesticks are also important for perfect strategy because it tells us about the future price action. We have to especially find the candles with the body as small as possible and wicks to both sides. However, the single wick to the opposite side is highly preferred. The marked candle in the below-mentioned MATIC/USDT chart is the perfect example of what kind of candlestick we have to look for in this strategy.
Stochastic Oscillator:
Stochastic Oscillator:
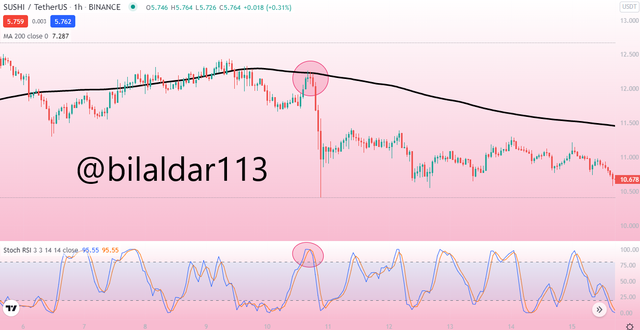
This indicator plays a great role for the successful execution for the perfect entry strategy. Once we have found the market structure and the required candle, we have to take a look at the stochastic. Suppose if we are opening a long position, then the indicator should be between 0 to 20, and if we are opening a short position, then it has to be between 80 to 100. The SUSHI/USDT chart was at the resistance line, which is 200 MA, and the stochastic indicator is between 80 and 100, which means we are all set to short the trade.
All these criteria must be met, and if you can find one of them, then don’t force the entry and simply wait for another signal.
“Practical”
Trade 2 demo account trades using the “Perfect Entry” strategy for both a “Bullish” and “Bearish” scenario. Please use a shorter period of time to execute your entries. Important you must run your entries in a demo account to be properly evaluated.
Trade 2 demo account trades using the “Perfect Entry” strategy for both a “Bullish” and “Bearish” scenario. Please use a shorter period of time to execute your entries. Important you must run your entries in a demo account to be properly evaluated.
Now, I will make a bullish and bearish trade at tradingview so that you can find out how the perfect strategy works in the financial market. I have used timeframes of 5 minutes and 1 minute to execute my trades.
Bullish Trade
Bullish Trade
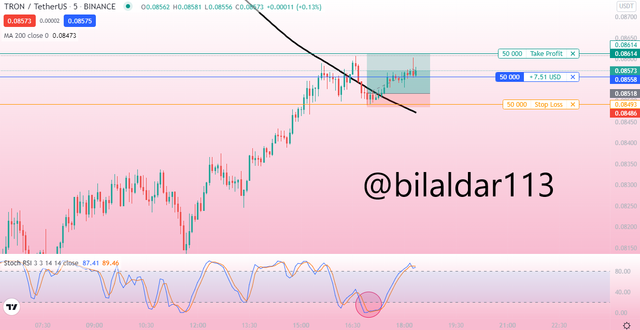
In the 5-minute time frame of TRX/USDT, the price was in an uptrend, and it was above the 200 MA, which means that it was totally bullish. Further, the stochastic oscillator was between 0 and 20, which means the asset was oversold and the candlestick was also according to our criteria. Thus, the requirement was fulfilled, so I opened a long position right away.
As you can see that my trade is currently in profit and since the stochastic indicator is ranging between oversold area, I can also consider booking profit.
Bearish Trend
Bearish Trend
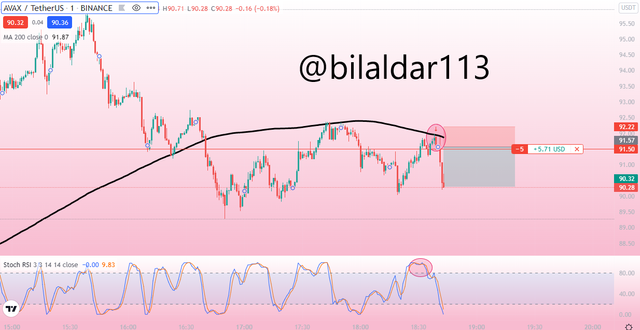
From the below chart of AVAX/USDT, you can see the price is bearish and below the 200 MA. The stochastic oscillator is at the overbought zone, and a candle with a small body was formed. The criteria were fulfilled, so I opened a short position and my trade hit the TP successfully.
Conclusion
Conclusion
After learning the perfect entry strategy, I think it can help traders a lot with scalping as it can provide accurate trade signals. But it is extremely important to consider every element like candlesticks patterns, 200 MA, market trend, and the stochastic oscillator to get much profitable trade signals.

Thanks For Visiting My Post
Cc: @lenonmc21
Sort: Trending
Loading...