Crypto Academy Season 5 Week 3- Understanding Trends II - Homework Post for @reminiscence01
Designed by @bilaldar113 Using Post Maker

Hey Everyone!
Hope all of you are doing great and having a great experience in learning from Steemit Crypto Academy. I will be doing this task with the knowledge of trading that I have gained from the valuable information provided by our esteemed professor @reminiscence01. I hope that I truly justify the hard work of the professor that he has done to teach this community about trend continuation and trend reversal.

1. a) Explain your Understanding of Trend Reversal. What is the benefit of identifying reversal patterns in the Market?
1. a) Explain your Understanding of Trend Reversal. What is the benefit of identifying reversal patterns in the Market?
In the world of finance and investments, a trend reversal is a term that refers to the change in the direction of a trend. It can either be changed in the prices of stocks, cryptocurrencies, commodities, or any other financial instruments. A trend reversal may be signaled by a number of factors, such as a sudden change in investor sentiment, news events, etc. However, there are various ways to identify the change in trend. Some of the most common methods include double bottom, double top, divergences, break of trendlines, and break of market structure.
There are tons of benefits of identifying trend reversal. The most foremost benefit is that it assists the traders in managing trades. Suppose that the price of an asset was in an uptrend, and it just broke the trendline. In that case, a professional trader will close the long position and open a short position with the preferred risk to reward ratio. It can be very useful to trade, so everyone should learn about various methods of identifying trend reversals.
b) How can a fake reversal signal be avoided in the market? (Screenshot needed).
b) How can a fake reversal signal be avoided in the market? (Screenshot needed).
Now we'll discuss how to avoid fake reversal signals in the market. The first thing to look for is an obvious trend reversal pattern. Some of the most common patterns include double top, double bottoms, head & shoulder, and divergences. Once any of these patterns are found, it can be deduced that the price of an asset can take the opposite direction. However, it can’t be the truth every time as the crypto market is extremely volatile, so it can fake the trend reversal anytime. But there are a few methods to avoid it.
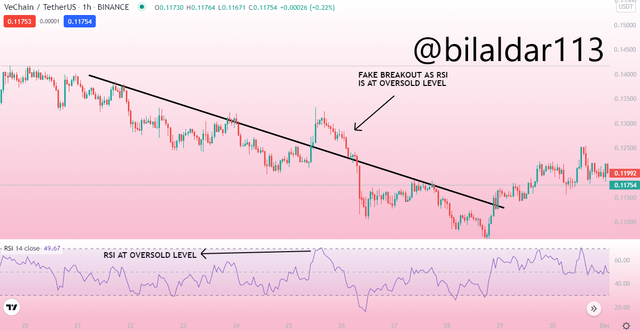
I personally prefer to use several indicators so that it can add confluence and save my capital from a fake trend reversal signal. I will also demonstrate how to avoid fake trend reversal using RSI and simple price action. So, observe the VET/USDT chart and see that it is in a complete downtrend. Out of the blue, it broke the trendline, which means that there could be a trend reversal. However, one has to identify it through other means for confluence, so I opened RSI and marked 2 lines which show that it is at an overbought level while the price is making higher high. It means that the pump is fake, making the trend reversal signal invalid.
2. Give a detailed explanation on the following Trend reversal identification and back up your explanation using the original chart. Do this for both bullish and bearish trends (Screenshots required).
2. Give a detailed explanation on the following Trend reversal identification and back up your explanation using the original chart. Do this for both bullish and bearish trends (Screenshots required).
There are a lot of ways to identify trend reversal. Traders should be able to identify it for bullish and bearish scenarios to open much profitable trades. I will be sharing details about some of the most preferred techniques to find trend reversal for uptrend and downtrend before the market change its structure.
Break of Market Structure
Bullish Market Structure
Bullish Market Structure
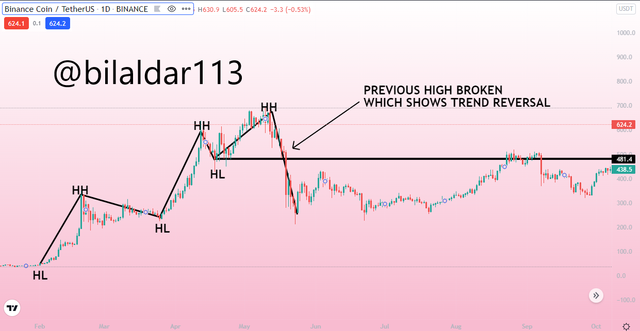
When the price is in a bullish trend, it makes a minor retracement after making a new high for trend continuation. We can also find out the market structure by drawing higher-high and higher-low. It is also ideal to find the change in trend as if the price is unable to make another high and makes a low by breaking the previous higher low, then it will be considered as a trend reversal signal. See from the chart of BNB/USDT that it was in a bullish trend until the price failed to sustain the trend and made a lower low by breaking the previous higher low.
Bearish Market Structure
Bearish Market Structure
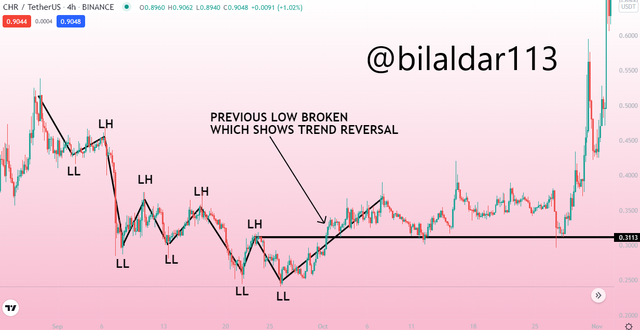
When it's about a bearish market structure, the price always increases after making a lower low to push the price further down. We can use this structure to identify the trend reversal; all we need is to observe the price action because if the price breaks the previous lower-high and crosses it, then we can consider the change in trend from bearish to bullish. As shown in the chart of CHR/USDT, the price couldn’t create another low and formed a higher high which shows that the price has turned bullish.
Break of Trendline
Bullish Trendline
Bullish Trendline
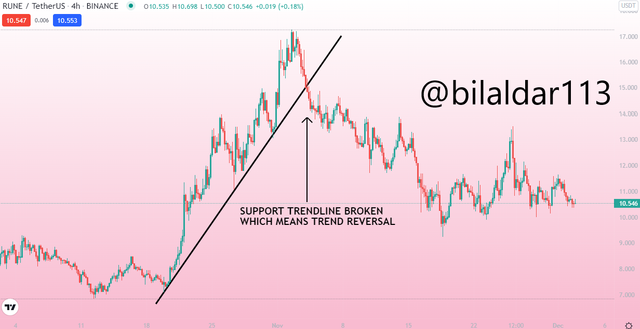
A bullish trendline work as a support for price and shows that it is an uptrend as it bounces by touching the line. If the price couldn’t respect the line and breaks it, then the price will start a downtrend rally which means that break of trendline signals for the trend reversal. As for the example from crypto market, the chart of RUNE/USDT shows that the price was rising suddenly the price broke the trendline and goes into bearish state.
Bearish Trendline
Bearish Trendline
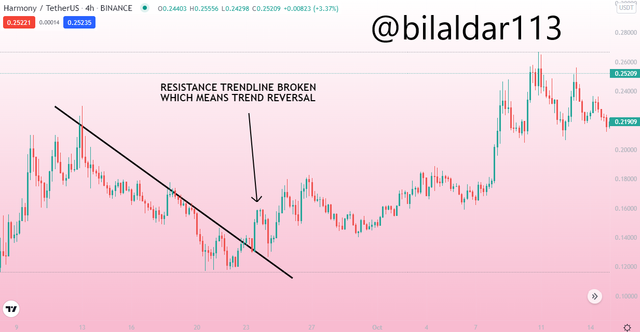
A bearish trendline works as a resistance to the price of a commodity that is in the downtrend. Break of the downward sloping trendline is a trend reversal pattern. It happens when the price breaks downward through a trendline. It signals the end of the downtrend and may indicate a reversal to bullish sentiment. So, it can be used to open a long position. For example, the ONE/USDT chart was in a downtrend and respecting the trendline, but the price broke the resistance and since that, it started a bullish trend.
Divergence
Bullish Divergences
Bullish Divergences
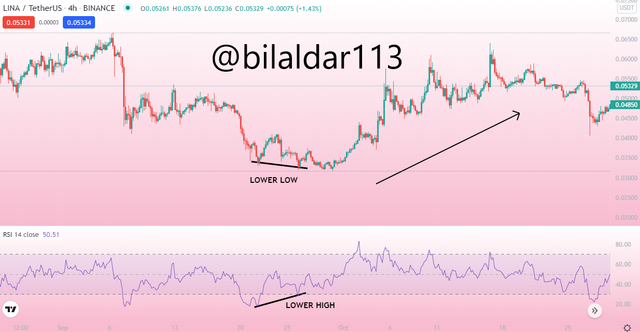
Bullish divergence is also widely preferred to find the change in trend as it shows that price is losing control from bears, and it can start a bullish trend anytime. We can find bullish divergence through a mixed signal between a famous technical indicator called RSI and the price of the commodity. As shown in the chart of LINA/USDT, the price was in a downtrend, but the RSI made a higher low, and the price made a lower low. So, the indicator signal was contrary to the price, which means a trend reversal. As a result, the price started an uptrend after making a bullish divergence.
Bearish Divergences
Bearish Divergences
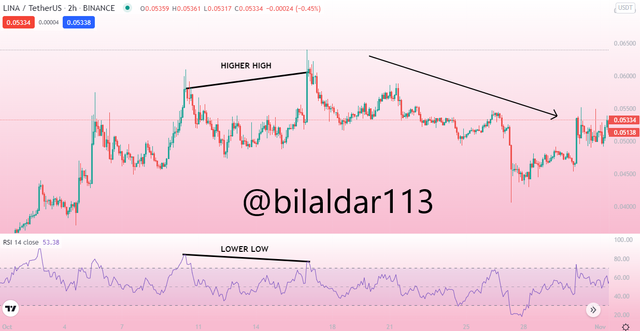
Bearish divergence shows that the bullish price can take the opposite direction. We can find it in the same way as bullish divergence. We have to carefully read the chart pattern and find the lower low in RSI and higher high in price. Once it is formed, the price won’t be in a bullish trend for a long time as the trend will be reversed. Take the example of LINA/USDT; the chart was making bearish divergence as highlighted, and later the price started a bearish trend.
Double top and Double Bottom
Double Top
Double Top
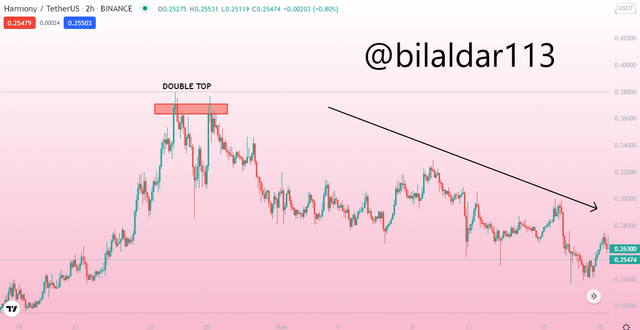
The double top is a chart pattern that occurs in a bullish market and represents trend reversal. When the price of any commodity makes a high and fails to pass the previous high, it will make a double top pattern. You can see from the ONE/USDT chart that the price made a double top which means that bulls are not able to push the price further and later a strong bearish move can be seen.
Double Bottom
Double Bottom
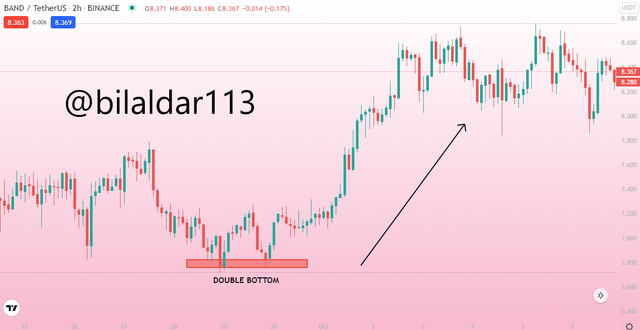
The double bottom is the same as the double top, but it has a different interpretation. When the price is in a downtrend and makes a low and but couldn’t make another lower-low, then a double bottom of equal length will be formed. The BAND/USDT made a double bottom during a downtrend, and you can see that the trend was changed right after that.
3. place a demo trade using any crypto trading platform and enter a buy or sell position using any of the above mentioned trend reversal/continuation pattern.
3. place a demo trade using any crypto trading platform and enter a buy or sell position using any of the above mentioned trend reversal/continuation pattern.
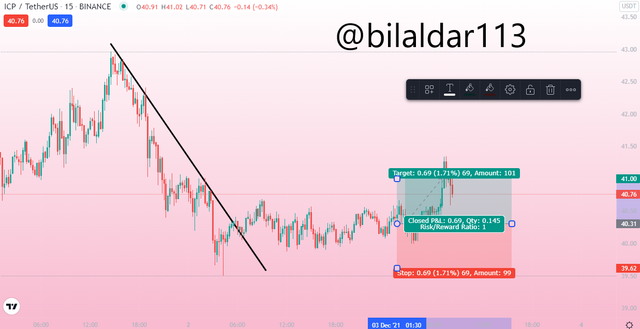
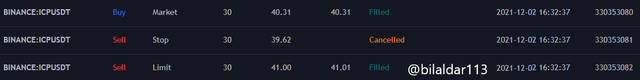
In order to show a demo trade, I have used tradingview to execute a successful paper trade through one of the preferred trend reversal patterns. I go through several chart patterns and find a strong downward trend on ICP. After making a trendline I noticed that the price has broken the it, which means that it is the right time to open a long position. So, I entered the trade at the price of 40.31 and purchased 30 ICP with the RR of 1:1.
Later the price went to the Take Profit area, which was 41. So, my trade was successfully executed.
Conclusion
Conclusion
From this homework, I got to learn about various trend reversal techniques for bullish and bearish market. Now I believe that it will help me a lot in trading as I will be able to manage trades according to the trend of the market. Thanks a lot to the professor for teaching this vital trading information with the Steemit Crypto Academy.

Thanks For Visiting My Post
Cc: @reminiscence01
#reminiscence01-s5week3 #club5050 #cryptoacademy #steemexclusive #trend #trendreversal #cryptocurrency
Hello @bilaldar113 , I’m glad you participated in the 3rd week Season 5 of the Beginner’s class at the Steemit Crypto Academy. Your grades in this task are as follows:
Recommendation / Feedback:
Thank you for participating in this homework task.
Thanks Professor.