Steemit Crypto Academy Season 2-Week6 | Cryptocurrency Trading with MACD indicator
What is the MACD indicator simply?
The MACD (MOVEING AVERAGE CONVERGENCE DIVERGENCE) its is a simple tool but most effective as a trading indicator MACD tool is used to identify the new trend of a market and it's bullish or bearish.
MACD indicator was developed by Gerald Appel in the late s 1970`s for trend following momentum indictor and oscillator and MACD (MOVEING AVERAGE CONVERGENCE DIVERGENCE) INDICATRO SHOW THE RELATIONSHIP BTW two moving average and also use for identity the enter and exit point form trading or market s.
I never used stock trading as per professor lecture MACD is one of the most popular calculation instrument to determining market trend.
Is the MACD Indicator Good for Trading Cryptocurrencies?
In Cryptocurrencies trending the MOVEING AVERAGE CONVERGENCE DIVERGENCE(MACD) indicator is liked for tis simple and stability to give A strong trending singles' Or enter and exit point, with standard setting in MACD the setting 12 period moving average 26 period moving average the period of the moving average will be depended up on time farm used in trading if we use one day chart then the output is 12 day moving average & 26 days moving average's their four MACD indicator is good for trading Cryptocurrencies.
Which is better, MACD or RSI?
let us Comparison: MACD (Moving Average Convergence Divergence) and RSI (Relative Strength Index) to know which is better
There are times when RSI (Relative strength index) has been found to deliver better result in crypto trading than MACD
A institute in the name of Polytechnic made a study in 2018 for developing a trend following trading strategy in that study they found MOVEING AVERAGE CONVERGENCE DIVERGENCE(MACD) is best predicting trends that have large market cap and small market cap in the compassion to middle market cap.
In that study MOVEING AVERAGE CONVERGENCE DIVERGENCE(MACD) given 80% percentage accuracy in trading. the market cap used in that study is large is 10$ billion & small 1$ billion
(MACD) is more reliable and stable in in variety of market and its best for all time frame the daily, weekly, and monthly time frame for an example if we use longer term trade signal setting will clear and smooth out the medium term volatility for indicating single, this very useful for Trading with more volatile for shorter term trade single when we trade more or Higher volatile assets or market we can use the smaller (MACD) to get single based on most recent trend date this will give as a opening to make a trading decision using most recent market data by out lining the longer time. frame
(MACD)MOVEING AVERAGE CONVERGENCE DIVERGENCE(MACD) is best suited for short term selling when comparison to RSI (Relative strength index) we will find better results using MOVEING AVERAGE CONVERGENCE DIVERGENCE(MACD) rather than the RSI (Relative strength index)
RSI (Relative strength index) give less trading single but give more accurate trading signals RSI is best for fundamental Analysis it give profit in most of every time
Conclusion
RSI (Relative strength index) & (MACD)MOVEING AVERAGE CONVERGENCE DIVERGENCE(MACD) both are basically momentum indictor tools used for technical training to know the strength of the market trend.
(MACD) will have over edge on other Cryptocurrencies trading scenarios when RSI will be the certain trading scenarios
My opinion both are not better than other both should be used in different scenarios both also have advantages and disadvantage.
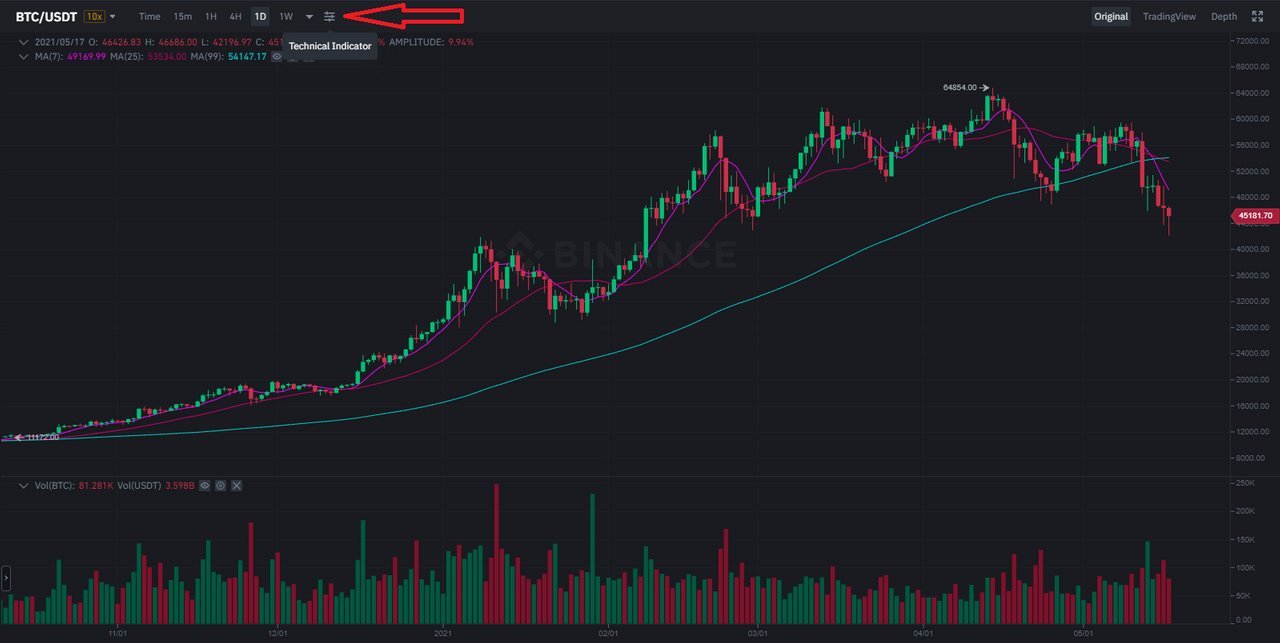
How to add the MACD indicator to the chart, what are its settings, and ways to benefit from them? (Screenshot required)I am going show you all how add the MACD indicator to chart for this I am using Binance.com ok let us begin
- Fist step find technical indicators option on you chat for me it is located in top right 10th option click on the technical indicators like show on the below image
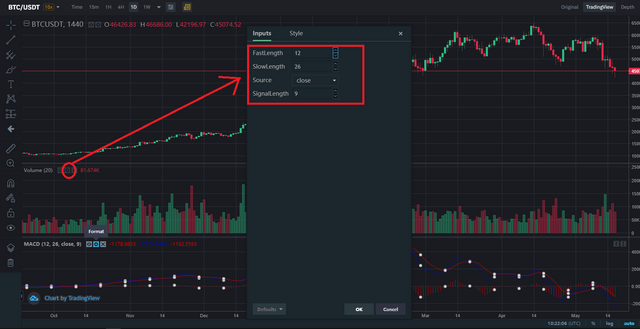
- 2nd step in search option search MACD and select the MACD which pop up when we search like in the below image

- 3rd step in our char below we see MACD indicator as been add and click on the setting icon it will give you two option inputs and style in inputs we put over MACD period in style we costumes line size colure and background colure

After reading professor lesson I have come to kwon we have 4 different terms in MACD
- MACD Line
- Signal Line
- Histogram
- The zero line
MACD line and signal line both very important in MACD indicator trading like professor said in lesson MACD is made up many indicator like green line is MACD Line, yellow line is Signal Line, bar chart 📊Histogram, when both MACD line and Signal line difference is zero The zero line is made the zero line represents the middle line of the histogram,
when MACD line crosses the Single line crosses it I considered to be trend reversal signals when it is happened in MACD indicator can see in below image MACD Line is crosses Signal Line when this happens price goes down 👇

How to use the MACD with the crossing of the zero line?
we can use zero line in two different trends when the MACD line crosses the Single line of the zero line there is potentially a sell signal and when Single line crosses the MACD line of the zero line there is potentially a buy signal when 12 period rise above 26 period in zero line there is potentially a buy signal if it is reversed 12 period goes below 26 period and 26 period rise above 12 period in zero line there is potentially a sell signal
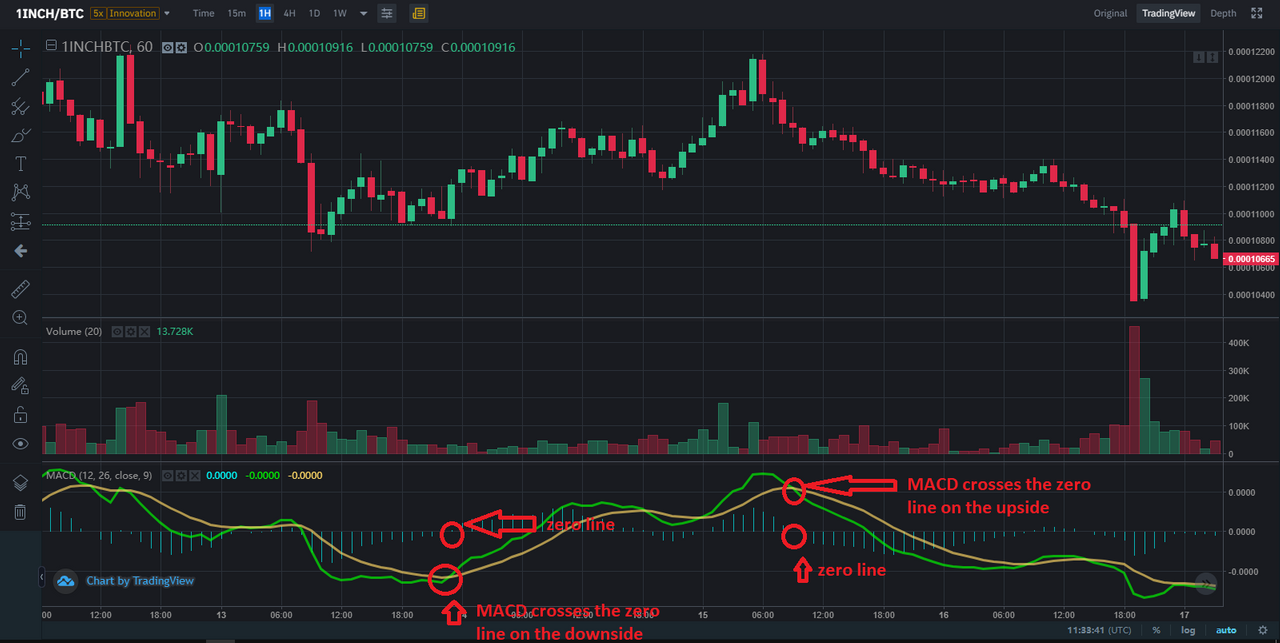
As we see above how to using MACD, Signal line, Zero line, we are to use this three indicators in MACD indicator
As the professor taught in his lesson MACD is calculated when MACD line crosses the Signal line it detect a down trend when it is reversed Signal line crosses MACD line it detect a up trend we also use Zero line this is coped from above answers (when 12 period rise above 26 period in zero line there is potentially a buy signal if it is reversed 12 period goes below 26 period and 26 period rise above 12 period in zero line there is potentially a sell signal) this how we detect a trend using MACD see the below image to know the down trend & up trend or enter and exit point.

how to filter out false signals?
we can not filter out false signals use only MACD because if use only one indicator we will get in to false signals for example in below chart I have add tow indicator MACD, RSI in below image I have put 2 box in RSI in fist box we can see that RSI didn't brake out the 50RSI resistance when MACD line crosses the Signal line 50RSI resistance brake out, the 2 signals was right so it went down trend,
in 2nd box we see the 50RSI resistance was not their it was below 32RSI Single line crosses the MACD line it means it should go up trend but it didn't go up it went down trend we can see in the image so we need more then one indictor to filter out false signals.
In the below image I shown how to use MACD indicator be used to extract points or support and resistance levels MACD line crosses the Signal line or Single line crosses the MACD line if both didn't brake out their highest& lowest point until it moves BTW highest& lowest point it in support and resistance levels.
when it brake out the support and resistance like in the image is no resistance or support to maintain support and resistance it need to be BTW highest& lowest point of MACD line crosses the Signal line or Single line crosses the MACD line like shown in the image

WE ARE GOING TO Review 1INCH_BTC FOR various signals from the MACD (MOVEING AVERAGE CONVERGENCE DIVERGENCE)
✊ The zero line The signal line MACD -Histogram : when Single line crosses the MACD line of the zero line or when 12 period rise above 26 period in zero line we can see in image this type of crossing has been occurred the price raised it means we should buy as i explained above we see support and resistance there is potentially a buy signal there is potentially a buy signal if it is reversed MACD line crosses Single line or 12 period goes below 26 period and 26 period rise above 12 period in zero line when occurred the price raised like shown in the image it means we should sell or there is potentially a sell signal
Hello @bharath-raj-m,
Thank you for participating in the 6th Week Crypto Course in its second season and for your efforts to complete the suggested tasks, you deserve a 4/10 rating, according to the following scale:
My review :
You have not answered the questions that deserve further research and in-depth analysis of the information. Try to read it before you start to answer so that the data is crystallized according to a clear methodology.
Thanks again for your effort, and we look forward to reading your next work.
Sincerely,@kouba01