Understanding Trends ;Crypto Academy / S5W1- Homework Post for @reminiscence01

1a) What do you understand by a Trending market?
b) What is a bullish and a bearish trend? (screenshot required)
The trending market is simply identified as the repetition of a pattern of higher highs and higher lows in a higher up-trending market and lower high and lower low in a down trading market.
The trending market is very simple, it entails how the market is going at the moment. It is above the 200EMA or below the 200EMA.
A trending market Is a situation whereby the prices of goods or commodity moves in a single direction. The trending market at this point will determine if a trader is to or sell at this particular of time.
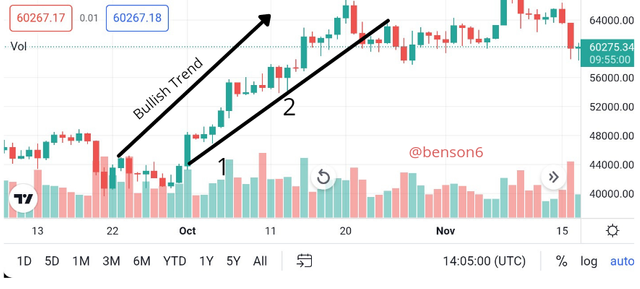
Bullish Trend
In the bullish market, the strength of the currency determines the higher-low and higher-higher arrangement. This exhibition shows that a trader can buy at this point because one stands a better opportunity of trading when it is trending in the market.
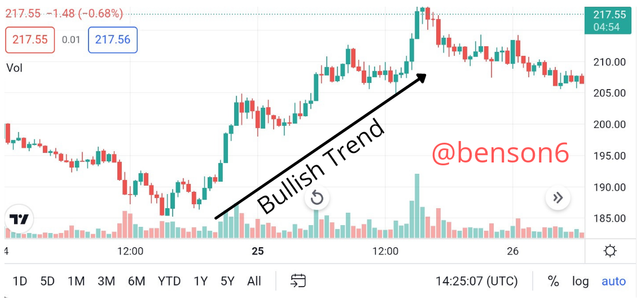
In the chart, it is seen the direction of the market's price. It moved from a low level to a high level thus giving a bullish trend.
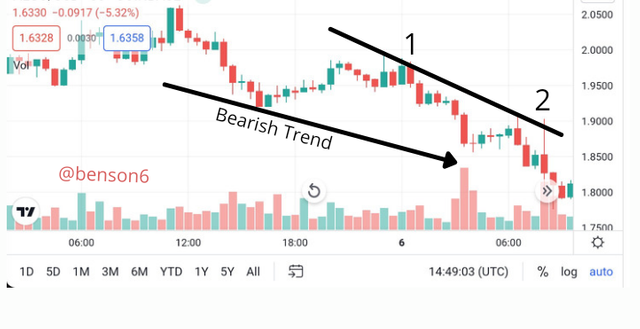
Bearish Trend
The bearish trend intends to display a lower-high and lower-low array. This exhibition shows the Euro GPR and this situation, GPR is stronger than the Euros and this shows that it selling at this particular point in time.
To be knowledgeable If is buying market (bullish) or selling market (bearish market, we have the best currency and code currency, Euro USDT, Euro Gpy, when the best currency is stronger than code currency, it is called buy market while when the code currency is stronger than best currency, it is called sell market.
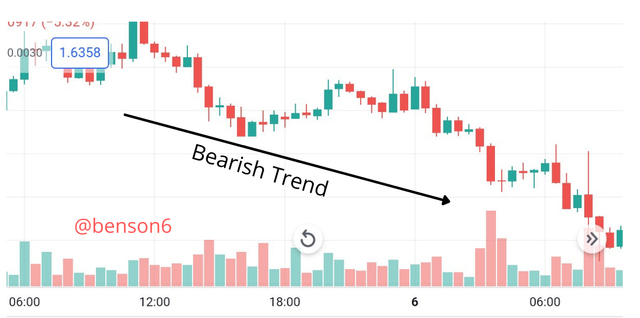
In the image, we can see that the price of the asset moved from a higher level to a lower level thus giving a bearish trend.
2) Explain the following trend identification and give an example of each of them. (Original screenshot needed from your chart). Do this for a bullish and a bearish trend.
i) Market Structure.
ii) Trendlines
Market Structure
A market structure defines the appearance of the market as it is moving. It usually shows the market in a bullish, bearish, or ranging mode. This appearance is shown with some points on the market giving some vital information.
A Break in market structure occurs when the market begins to shift direction and break the previous HH (higher high) and HL(higher low) or LL (lower low)and LH (lower high) of the market.
I shall be discussing some of this points in a bullish and bearish trend.
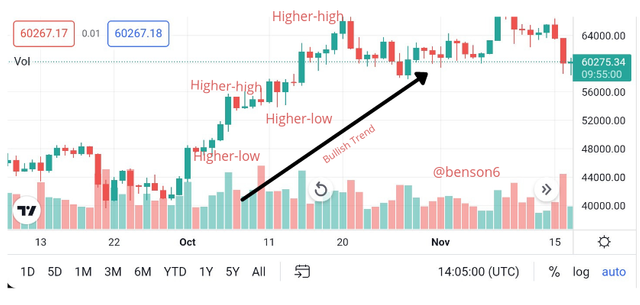
The image above is the market structure for a bullish trend. At the start of the trend, the market was at a low point then moved upwards. During its upwards movement it experienced pullbacks at different points. These pullbacks led the bullish trend to experience what is known as higher highs and higher lows.
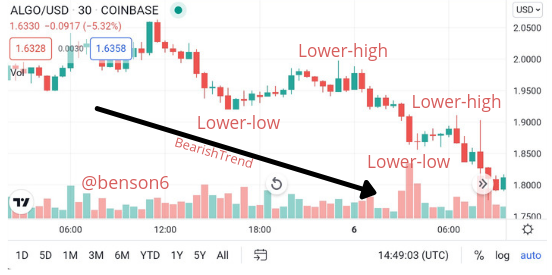
In the same vein the bearish market also experienced what is known as lower lows and lower highs as it moved from a high price point to a low price point.
Trend Lines
These are simply diagonal lines that highlight a trend or price range. These lines follow the price movement in an attempt to give traders a general sense of how high or low the price might go in a given timeframe. When the price sky rocket, the trend line rises accordingly. When the price falls, the trend lines fall likewise.
Trend lines don't detect significant lows in an uptrend and they connect significant highs in a downtrend, creating dynamic resistance. Dynamic resistance means that as time shifts like does the price also change in variations. For instance, in an uptrend, the support goes up as time proceed.
The bullish trend line is shown when the trend line is below the bullish market formation. It is placed under the higher lows in a bullish market structure. It usually follows two higher low points but if it connects more than that it shows that the bullish trend is stronger. The trend line acts as a dynamic resistance line whereby the price hits it and bounces back. But it if breaks below the line then we can expect a trend reversal.
The bearish trend line is shown when the trend line is above the bearish market formation. It is placed on the top of the lower highs in a bearish market structure. It usually follows two lower high points but if it connects more than that it shows that the bearish trend is stronger. The trend line acts as a dynamic support line whereby the price hits it and bounces back. But it if breaks above the line then we can expect a trend reversal.
3) Explain trend continuation and how to spot them using market structure and trendlines. (Screenshot needed). Do this for both bullish and bearish trends.
Trend Continuation is kinda simply because whatever display continuation, it simply entails that the trend is going up and is at a buying level. When a green candle is shown doesn't have a wig, it doesn't have a wig up or wigs down, after this single act, the next candle is sure will be continuous buying.
Trend continuation signifies that a trend is 'continuing' in its initial direction where it had momentum. During it's movement it experiences pull back a which signifies that traders are taking profit at such points. These pullback points also serve as good points for market entry. There continuation occurs in both a bullish and bearish market.
There are rules that must be followed for a trend continuation to be confirmed.
For a Bullish Trend:
- The highs the market experiences must be higher than previous high.
- The lows the market experiences must be higher than previous low.
For a Bearish Trend:
- The lows the market experiences must be lower than previous low.
- The highs the market experiences must be lower than previous highs.
How to spot the using market structure and trendlines. During this process, when the trendlines are drawn and it touches the higher lows, this display that the market will continue buying or it touches the lower highs, this display shows that it will continue selling.
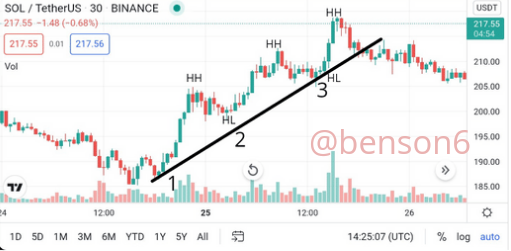
This image is a depiction of a bullish trend continuation using both the market structure and trend line. We can see that the initial high depicted HH had other higher highs above it. At the same time the lows depicted HL were higher then the previous one. This is the market structure. While the trend lines was placed at the higher lows which served as a dynamic resistance line. The prices continued hitting it and moving upwards.
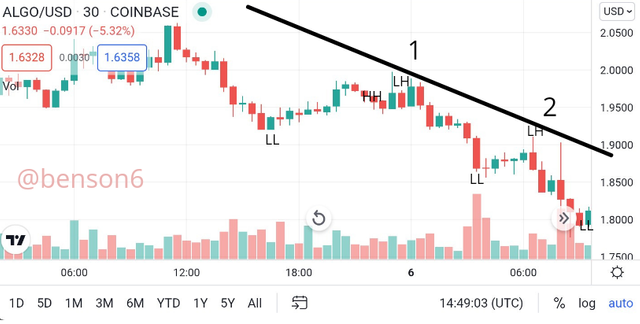
This image is a depiction of a bearish trend continuation using both the market structure and trend line. We can see that the initial low depicted LL had other lower lows below it. At the same time the highs depicted LH were lower then the previous one. This is the market structure. While the trend lines was placed at the lower highs which served as a dynamic support line. The prices continued hitting it and moving downwards.
Pick up any crypto-asset chart and answer the following questions.
i) Is the market trending?
ii) What is the current market trend? (Use the chart to back up your answers).

The chart is a presentation of SHIBUSDT in the 30 minutes timeframe. The market experienced a downtrend on the 18th of October. As can be seen the market structure shows the downtrend with its Lower lows and lower highs depicted as LL and LH.
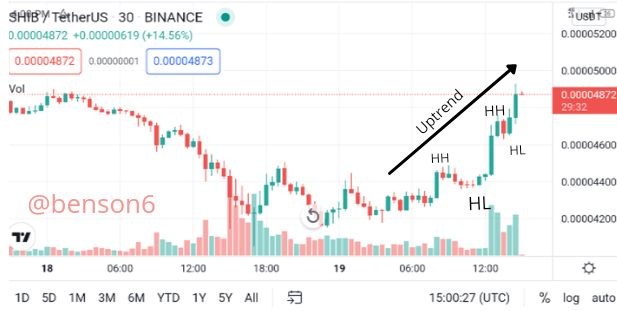
But so far today the market has been experiencing an uptrend. This is the current movement of the market as at the time of writing. It is shown by the higher high and higher lows as depicted by HH and HL.
Conclusion
The trending market at a particular at the time determines how many traders will venture into the market. When the market is trending, the traders and sellers stand a better chance of earning at a specific time. It is needful for traders to identify if the market is trading or not so that, they will not go bankrupt. With the aid of market structures and trend lines, we can easily predict the next market price action that awaits us at the tunnel.
In a situation where the market is not trending in terms of going up or not, it is known as a consolation market.
