Trading Using Rectangle Pattern - "Crypto Academy / S5W4 - Homework Post for @sachin08"

1. Explain Rectangle Pattern in your own word.
The Rectangle pattern is a chart pattern recognition carried out by traders to help them better predict the future movement of the price of an asset. It is a price formation that occurs during a trend where the price reaches a point where it moves in an equal movement up and down, thus forming Tops and Bottoms in the process. It is made up of two horizontal trendlines namely: Top Trendline & Bottom Trendline.
The way to spot the Rectangle pattern is by drawing the top trendline at the tops and the bottom trendline at the bottoms of the pattern formation in the trading chart. The two trendlines that are drawn at the top and bottom also serve as support and resistance levels. The ideal rectangle pattern consists of 3 touches of the price at the top trendline and at the bottom trendline.
When spotting the formation of the rectangle pattern, the horizontal lines must be drawn when the price makes an equal movement. This period can sometimes mean that there is a power tussle between the bulls and bears where the price doesn't have a certain direction, it can also mean that the price is Ranging at the moment, or it can show that the price is in the accumulation or distribution phase depending on the movement of the markets. It is a formation that shows itself above or below the movement of a price.
During price movement, when the price is moving downwards and it enters the rectangle pattern phase, it usually signals a price movement continuation downwards. Likewise, when the price is moving upwards and it enters the rectangle pattern phase, it usually signals a price movement continuation upwards.
In both instances, the price has an exit from the rectangle pattern phase called a Breakout, and the breakout can be in any direction. However, for the price to breakout downwards, it must close below the bottom trendline, likewise, for the price to breakout upwards, it must close above the top trendline.
2. How to identify Rectangles. Explain with Screenshots.
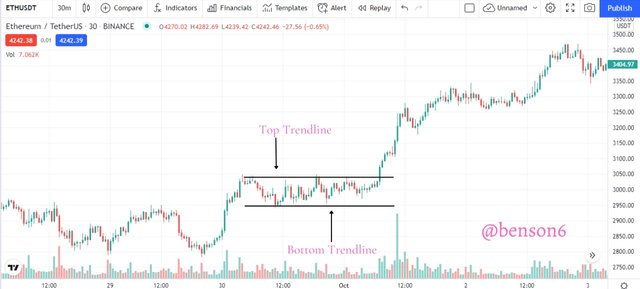
The Rectangle pattern is identified through Price Trend and Horizontal Trendlines. The price is first trending in a direction then it gets to a point where the price starts to move up and down in a zig-zag manner without the price moving higher or lower than the zig-zag points, thus forming tops and bottoms. That is, during the up and down movements the price doesn't make an apparent bullish or bearish movement.
It is during this phase that we draw the top horizontal trendline at the tops formed in the up and down movement and also draw the bottom horizontal trendline at the bottoms formed in the up and down movement.
By drawing the top horizontal trendline at the tops and the bottom horizontal trendline at the bottom, a "Rectangle Shape" is formed to bring out the rectangle pattern. After drawing the horizontal line it is seen that the price is in a band within the top trendline and bottom trendline that forms the rectangle pattern.
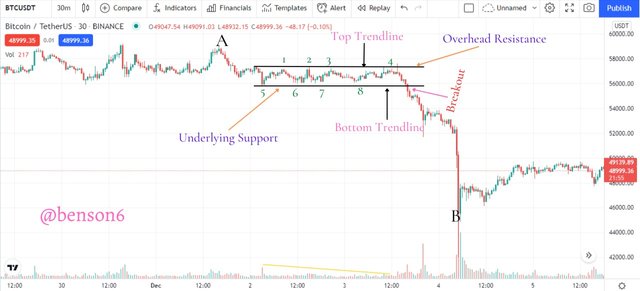
From the image above we can see the price trend and horizontal trendlines in identifying a rectangle pattern. The price trend shows a downtrend from point A to point B.
As the price trended downwards, it reached a point where the price moved up and down in a zig-zag manner, forming tops and bottoms. During this time a horizontal trendline was drawn at the top to connect the tops and a horizontal trendline was drawn at the bottom to connect the bottoms. The touches in this rectangle pattern were up to eight shared as 4 each between both trendlines.
The price movement was bounded by the top trendline and the bottom trendline as it bounced between the top trendline and the bottom trendline. The top trendline acted as the overhead resistance level and the bottom trendline acted as the underlying support.
It is also of note that the volume indicator showed a decrease during the time the price entered the rectangle pattern phase.
3. Can we use indicators with this pattern to get accurate results? Explain with Screenshots.
We can use the Rectangle Pattern in conjunction with some technical indicators and get accurate results. One of such technical indicators is the Bollinger Bands (BB).
Bollinger Bands is a technical indicator that performs so many functions. It shows when the price is trending either up or down, it shows when the price is in a range, it also shows when the price is about to experience a trend reversal. When the Bollinger Bands expands it indicates that the market is trending or about to experience a trend reversal. When it contracts it shows that the market is in a range.
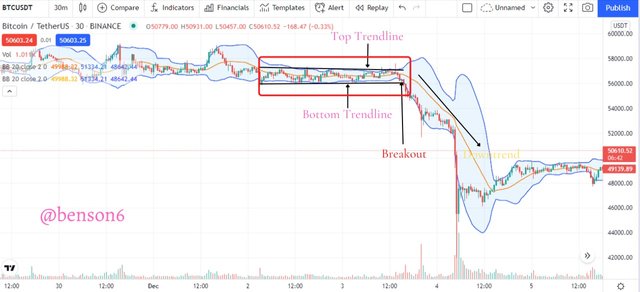
In the chart above, we can clearly see a combination of the rectangle pattern and the Bollinger Bands. During the formation of the rectangle pattern as shown by the top trendline and the bottom trendline, the Bollinger Bands had a contraction or a "squeeze" which is captured by the red shape. The tops and bottoms on the rectangle pattern were touching the upper band and lower band of the Bollinger Band indicator.
So it was expected that once the price breaks the bottom trendline which acted as an underlying resistance level a trend to the downside would occur. This is exactly what happened, the price broke out of the bottom trendline and moved downwards. This was indicated on the Bollinger Band as it expanded and also faced downwards.
4. Explain Rectangle Tops and Rectangle Bottoms in your own words with Screenshots of both patterns.
There are two places on the trading chart that the rectangle pattern can be found. It can either be found at the top or at the bottom of the trading chart. It is these instances that give rise to the terms Rectangle Tops and Rectangle Bottoms.
Rectangle Tops
A rectangle top is a rectangle pattern formation that is usually found at the top of a trend. As earlier stated this could be a result of the bulls and bears having a tussle or it could mean the price is in the distribution phase. As the rectangle top forms, the price moves within the top trendline and bottom trendline.
When the rectangle tops pattern forms, we expect the price to break out from the bottom trendline which acts as an underlying support level. And when the breakout occurs a bearish movement would occur which then signifies that the bears are in full control of the price and traders can place sell entries or close their buy entry position.
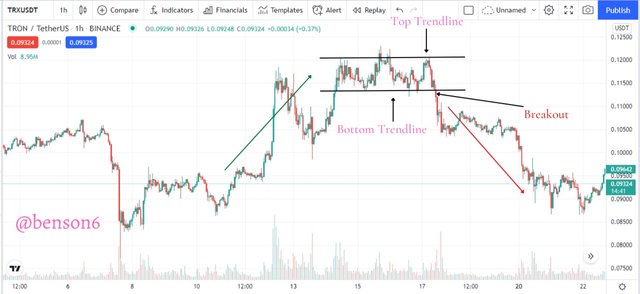
In the chart above, there was an uptrend as shown by the green arrow. Then the price reached a certain level where it formed a rectangle pattern to give a rectangle top. The uptrend went into the rectangle pattern. When the price entered the rectangle formation it kept moving within the band of the top trendline and bottom trendline until it broke out of the bottom trendline.
After the breakout, the price moved in a bearish direction as shown by the red arrow.
Rectangle Bottoms
A rectangle bottom is a rectangle pattern formation that is usually found at the bottom of a trend or the start of a new trend. It can be found at the base of an uptrend just as the uptrend is starting or at a downtrend at the bottom of the trend. This could be the result of the bulls and bears having a tussle or the price is in the accumulation/distribution phase. As the rectangle bottoms form, the price moves within the top trendline and bottom trendline.
When the rectangle bottom pattern forms, we expect the price to break out from the top trendline which acts as an overhead resistance level. And when the breakout occurs a bullish movement would occur which then signifies that the bulls are in full control of the price and traders can place buy entries or close their sell entry position.
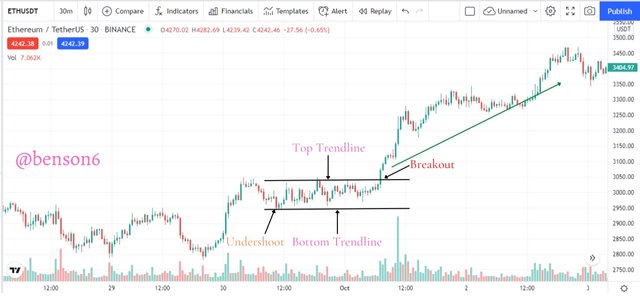
In the chart above, it can be seen that an uptrend was just starting. Then the price reached a certain level where it formed a rectangle pattern to give a rectangle bottom which is at the base of the uptrend. It formed after an undershoot. When the price entered the rectangle formation it kept moving within the band of the top trendline and bottom trendline until it broke out of the top trendline.
After the breakout, the price moved in a bullish direction as shown by the green arrow.
5. Show full trade setup using this pattern for both trends. ( Entry Point, Take Profit, Stop Loss, Breakout)
Rectangle Top
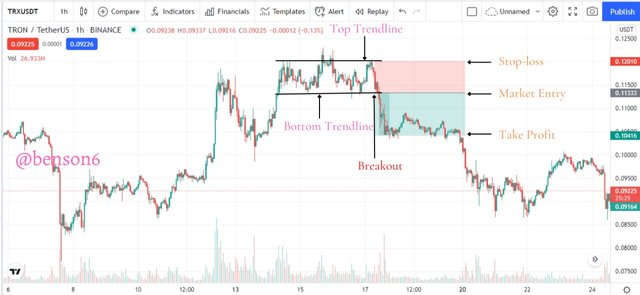
In the chart above, a rectangle pattern is formed at the top hence a rectangle top. The price moves within the top trendline and the bottom trendline. The breakout occurred at the bottom trendline which signaled a downtrend. So a sell market entry is opened, then a stop-loss is placed close to the top trendline or just above it, and a take profit is placed in a ratio 1:1 or 1:2.
Rectangle Bottom
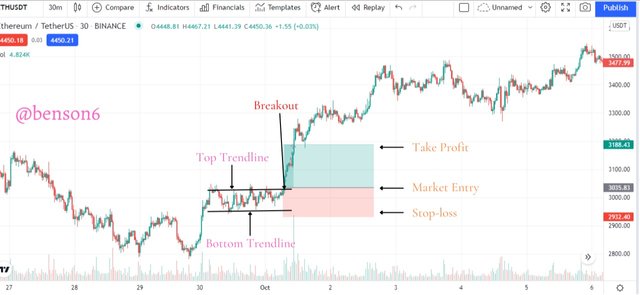
In the chart above, a rectangle pattern is formed at the start of the trend which is at the bottom hence a rectangle bottom. The price moves within the top trendline and the bottom trendline. The breakout occurred at the top trendline which signaled an uptrend. So a buy market entry is opened, then a stop-loss is placed close to the bottom trendline or just below it, and a take profit is placed in a ratio 1:1 or 1:2.
6. Conclusion
A rectangle pattern is another pattern recognition in the trading charts, it is imperative for all traders to have an idea of the pattern formation and recognition. It is a pattern formed when the price of an asset enters a phase where the price moves up and down as in a range, without having any definite direction. It consists of an upper trendline and a lower trendline. It comes in different forms such as a rectangle top and a rectangle bottom.
It is a technical analysis tool that gives good results as the market usually moves after it has gone through the rectangle pattern phase. However, it is paramount that traders use another technical indicator that is in confluence with the rectangle pattern so as to get excellent results.