Crypto Trading by Identifying Support and Resistance - Steemit Crypto Academy | S6W3 | Homework Post for @shemul21
 Image Created on Canva
 What is the Support & Resistance zone?
A Support & Resistance Zone is an area or price level where the price reaches and changes its direction. It is the level where the buying and selling pressure is the highest. Therefore, it shows when buyers are most active and when sellers are most active.
So when the price is moving in a particular direction then it reaches a certain level and changes its direction, that level is known as a support or resistance zone. When the price reaches such a level and changes direction, it means the buying or the selling pressures at that time were sufficient enough to change the direction of the movement of the price.
On the chart, it is basically shown as a horizontal area where the price reaches and hits and then changes direction. However, there are other ways by which the support & resistance zones can be identified.
 Tradingview
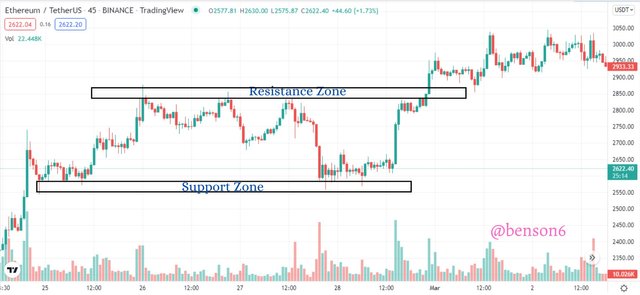
 In the image above we can see the basic support and resistance levels. As the price moved upwards, it got to a period where the price moved within two price levels. These levels acted as our support and resistance zones. Afterward, the price broke the resistance zone and began to move upwards.
The support and resistance zones are a very important aspect in technical analysis as well as trading. With it, we can get some important information about the price of an asset. We can see if the price is moving in a trend if it's moving in a range, if a trend reversal is about to occur, and if there's about to be a trend continuation. When the support zone is broken it becomes a resistance zone, likewise, when the resistance zone is broken it becomes the support zone.
In addition, the support and resistance levels are stronger in higher timeframes when compared with lower timeframes. By getting such important information we can use it to our benefit by placing market entries and knowing when to exit.
Explain different types of Support & resistance with proper demonstration.
There are 3 types of Support & Resistance levels which is a representation of how they are formed and how they are represented on the trading chart. They are:
- Horizontal Support & Resistance levels.
- Sloping (Diagonal) Support & Resistance levels.
- Dynamic Support & Resistance levels.
I shall be going into details about them. But there are 4 main rules to follow when trying to identify the support & resistance levels. They are:
- Let your trading chart be clear, let there be no indicator as this would help you easily identify the support & resistance levels.
- Zoom the chart to get a much clearer view.
- Connect all the price levels where the candlesticks hit and change direction.
- When connecting the price levels, you can use the candlesticks, wicks, or both (but I recommend you use both for better analysis and better results).
Now that we have seen the 4 rules to follow, I shall go into detail on the types of support & resistance levels.
Horizontal Support & Resistance level
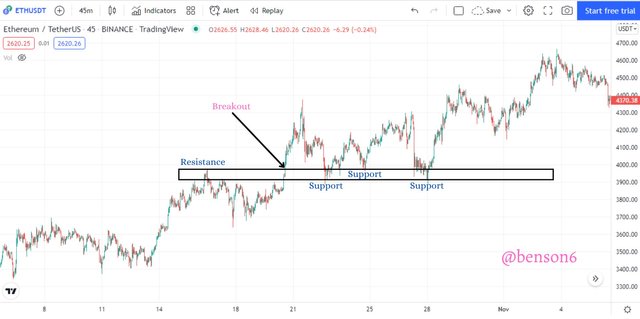
A horizontal support & resistance level is a price level where the price forms a horizontal shape when drawn to connect the levels that it touched and changed direction.
It can occur as one full horizontal shape which cuts across a certain level that the price touched multiple times for a given period of time. It can also occur as two different horizontal shapes which form as a result of the price touching separate levels multiple times. The former horizontal shape is a shape that acts as both support and resistance where the price hits and changes direction or breakout from and move in the new direction thus forming new support or resistance level. The latter is two horizontal shapes where one acts as support and the other acts as resistance zones.
 Tradingview
 In the image above we can see how the price formed one full horizontal shape as the price touched different levels as it moved upwards. When the price started its upward movement it touched the level and came back down thus making that level a horizontal resistance level. Some moments later the price broke that level and went up. After the breakout from the resistance level, the price came down to that level and touched it 3 times thus that level became horizontal support, before finally continuing in its upward movement. In the image, it occurred when the price was moving up, it can also occur when the price is moving down and when the price is moving to the side
 Tradingview
 The image above is the second way the horizontal support & resistance levels can occur. It has two horizontal shapes where the first one is horizontal support and the second is horizontal resistance. In this case, the price did not cut across a price level that acted as both support & resistance, instead, it had two distinct price levels where the price touched multiple times thereby forming horizontal shapes as support & resistance levels.
Sloping (Diagonal) Support & Resistance levels.
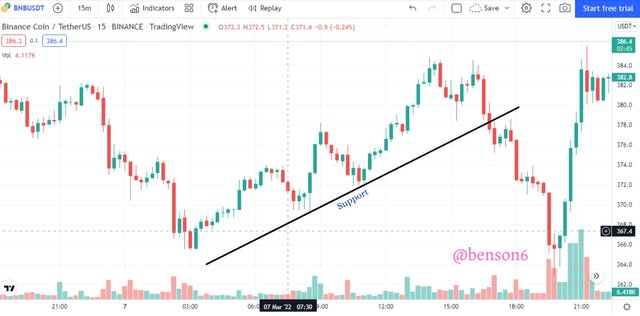
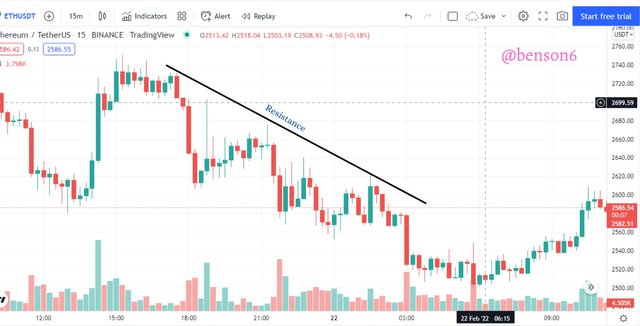
Sloping or diagonal support & resistance occurs when the price is moving in a Trend. When the price is in a trend it forms a market structure which helps us to identify the trend. If it is an uptrend the price moves in such a way that it has higher highs and higher lows. The higher lows are connected using a trendline which in turn acts as the sloping support. Likewise, if it is a downtrend the price moves in such a way that it has lower lows and lower highs. The lower highs are connected using a trendline which in turn acts as the sloping resistance.
The sloping support faces upwards and the sloping resistance faces downwards.
 Tradingview
 In the image above we can see how sloping support is presented. The price moved in an uptrend which gave a market structure with a series of higher highs and higher lows. The higher lows were connected with a trendline to form a Sloping Support that is facing upwards.
 Tradingview
 In the same vein, the image above shows how a sloping resistance is presented. The price moved in a downtrend which gave a market structure with a series of lower lows and lower highs. The lower highs were connected with a trendline to form a Sloping Resistance that is facing downwards.
Dynamic Support & Resistance levels.
Dynamic support & resistance is where the price experienced a pullback or trend continuation during its movement in a direction. It is similar to that of slope support & resistance, however, we are not looking at the market structure but how the price behaves in certain instances.
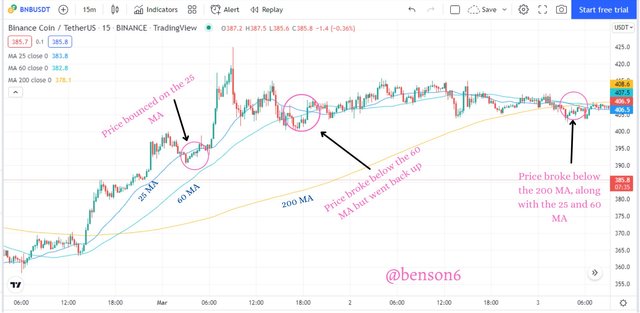
To get the dynamic support & resistance, we make use of 3 Moving Average indicators (SMA, EMA, or WMA). When the price is moving in a trend the moving averages move along with it, so when the price hits the moving average it acts as dynamic support or resistance and we can get some vital information from it.
 Tradingview
 In the image above we can see a clear illustration of the dynamic support. We have three SMAs, 25, 60, and 200 which acted as the dynamic support.
As the price moved upwards, it bounced on the 25 MA and continued moving up. Then it goes to a time the price broke below the 60 MA and went back up until finally it went and broke below the 200 MA.
We can see that we got a trend continuation when the price bounced on the 25 MA, we got a signal that the trend may reverse soon when the price hit the 60 MA and continued moving upwards. Then when the price crossed the 200 MA, a trend reversal is expected to happen.
 Tradingview
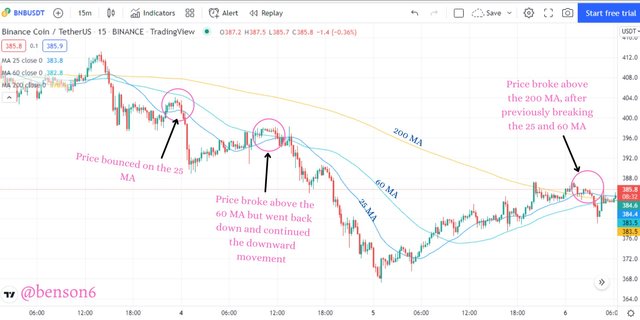
 We can also see another image where there was a dynamic resistance. As the price moved downwards, it bounced on the 25 MA and continued its movement downwards. Afterward, it broke above the 60 MA then went back downwards. Then it got to a point the price broke above the 25 and 60 MA then went on to break the 200 MA.
We can also see the trend continuation signal when the price touched both the 25 & 60 MA. Then it finally went and broke above the 200 MA which can signal a new trend direction.
In both instances, the distance between the 200 MA and the 25 & 60 MA showed the strength of the trend.
Identify The False & Successful Breakouts. (demonstrate with screenshots)
A breakout is a situation where the price hits a level that acts as a support or resistance zone, then it eventually breaks it and continues moving. It can hit the level once or several times. Because of the nature of breakouts they are classified into Successful & False breakout.
1. Successful Breakout
As the name suggests, a successful breakout is one in which price breaks out from a support or resistance zone and moves in the new broken territory. It consists of two types namely:
- Continuation Breakout
- Reversal Breakout
Continuation Breakout
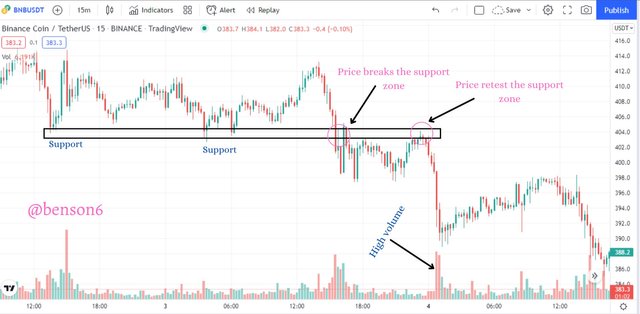
A Continuation breakout is a situation where the price is trying to move in a direction then it encounters some repulsion until it aggressively forces itself in that direction in the process breaking out from any support or resistance zone and keeps moving. When the zone is broken it can go back to retest, or it can just keep going depending on the volume at the time.
 Tradingview
 The image above shows the illustration of a continuation breakout. The price tried to move in a downtrend, but it experienced repulsions as it tried to move downwards. Those levels it experienced repulsions are the support levels. Then it got to a time the price moved and broke the support zone and moved downwards. Although it had a retest of the zone, after that it continued in its downtrend
Reversal Breakout
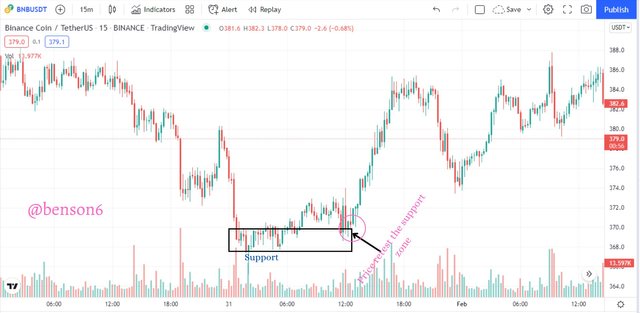
A Reversal breakout is a situation where the price is moving in one direction then it enters a zone after which the price breaks out and starts moving in the opposite direction. The zone is sometimes seen as a Range where the price is moving sideways where it doesn't move up or down.
 Tradingview
 We can see in the image above where the price moved downwards, then entered a period where the price moved in a range or sideways. After that, the price broke that zone and went the opposite of the previous direction (up). Although it came back to retest the zone, later on, it continued in its direction.
2. False Breakout
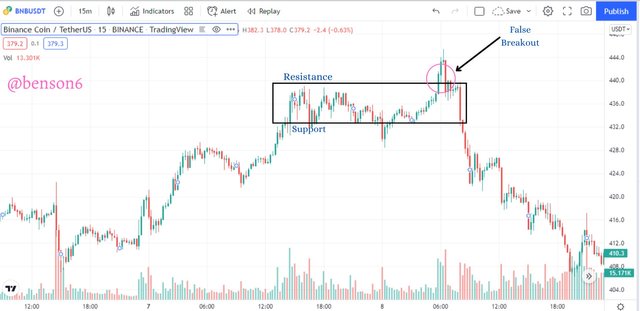
A False breakout is a situation in the market where the price breaks a support or resistance zone, sometimes very strongly, then goes back and move in the opposite direction. It could mean that buyers or sellers were waiting for the breakout then make buying or selling pressure so strong that it would make the price move in the opposite direction. It could also mean that price had run its course and didn't have any energy left to continue the movement so it 'fell' back.
 Tradingview
 In the image above, we can see that the price was moving upwards then it entered a zone where the price moved in a range. The zone acted as a support and resistance zone. The price eventually broke out from the zone but it did not go in the direction of the breakout, instead, it went in the opposite direction.
Use Volume and RSI Indicator Combined with Breakouts & Identify the Entry Point. (demonstrate with screenshots).
In this exercise, I would use three techniques to identify a market entry and make my trading plan. The three techniques are the use of support & resistance breakouts, volume indicator, and RSI indicator.
The volume indicator is used to show the volume of activities going in the market. It is comprised of bars which are green and red. If a volume is high, the bar will increase and if the volume is low, the bar will decrease.
The RSI on the other hand is an indicator that shows the strength of buyers and sellers. It is a momentum indicator that shows who's in control of the price of an asset. It also shows the degree to which those in control can reach before they cease control and the other set takes over. The degree is usually placed at two ends of the bands which are 70 & 30, but it can also be 80, 20. It also has a middle band of 50.
In this exercise, we are going to use a different style with the RSI. Here we'll remove the 70 & 30 bands and make use of only the middle band (50).
 Tradingview
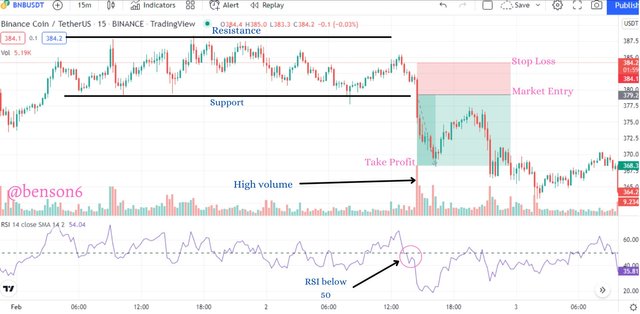
 In the image above, we can see the effect of the 3 techniques. The price moved up, then it got to a point where it moved in a zone. This zone is also the range that the price experienced. In this zone it had but support and resistance levels. After that, the price broke from the zone and started to move in the opposite direction.
At the break of the zone, the RSI indicator went below 50 which shows that sellers are in control of the price and the volume at that time was very high as shown by the increase in the red bar.
A market entry is placed just below the break of the support level, then the stop loss is placed at the highest point the price reached above the support level of the zone and the take profit is placed at a ratio of 1:3.
 Tradingview
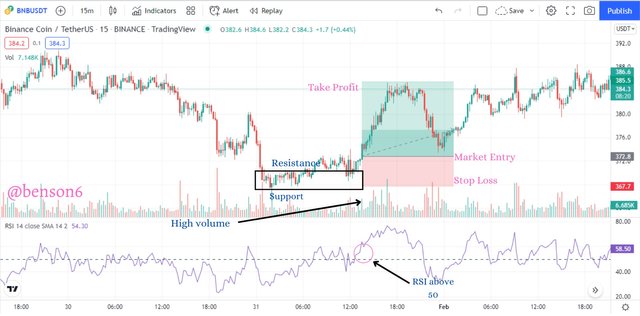
 This other image shows when the price was moving down, then it entered a zone, which consisted of the support and resistance levels, where the price moved in a range. The price broke out of the zone but came back to retest the zone, before finally moving in its new direction.
On the RSI we can see that after the price came to retest the zone, the indicator was below 50 slightly before finally moving above 50. And on the volume indicator, we can see that the volume was high as shown by the green bar.
A market entry is placed around or just above the high point the price reached before the retest of the support & resistance zone, then the stop loss is placed at the support level of the zone and the take profit is placed at a ratio of 1:3.
It should be of note that both illustrations showed a reversal breakout.
Take a Real Trade(crypto pair) on Your Account After a Successful Breakout. (transaction screenshot required).
In this section, I'm going to perform a trade using the breakout from support & resistance zones. I'm going to use the combination of RSI and Volume indicators along with the breakout of support & resistance levels.
 Tradingview
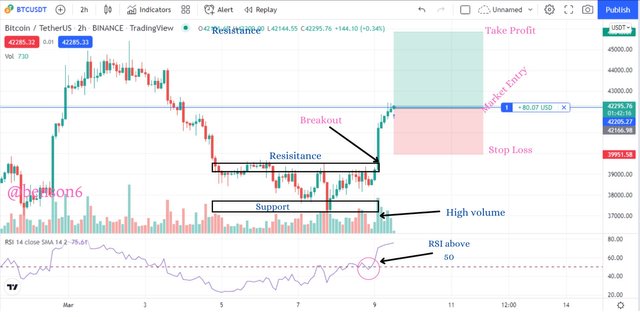
 The image above is a 2 hrs chart of BTCUSDT. We can see that the price initially moved downwards, then it entered the support & resistance zone. After some time the price broke out of the zone through the resistance point.
At the breakout the RSI indicator was above the 50 mark to indicate that the buyers are in control, also the green bar was very high on the volume indicator.
So I placed a buy entry, with my stop loss and take profit levels of ratio 1:2.5. However, the entry was a little late from the breakout as I just found it.
 Tradingview
 This is the history of the trade to show the transaction details of the trade.
This is a Demo trade and not a Live trade as I couldn't gain access to my live account at the time of doing this exercise.
Explain the Limitations of Support & Resistance (false breakout).
As we have seen so far trading with support & resistance can be very helpful as it shows us how price behaves in different instances. It also gives us an idea of how to place our market entry and exit orders.
However, there are some limitations that trading with support and resistance can give.
Sometimes the price can hit a support & resistance zone multiple times thus bringing confusion to traders. The price can hit a support & resistance zone, go back to where it came from, then go back and hit the zone again. After a while, the price can then break out of that zone and we expect it to move in the direction of the zone it broke out from only to go back and hit the zone again, sometimes breaking the zone again.
Another instance is that the price can be in the support and resistance zone, break out of the zone but rather than move in that direction it moves in the opposite direction.
 Tradingview
 In the image above we can see that the price entered a support and resistance zone as it moved upwards. Then it broke out of the zone, but rather than moving upwards, it turned back down and started moving downwards.
Conclusion.
We have seen that support & resistance is a zone where the price can hit and change direction, or it can break out from that zone. There are three ways by which we can identify support & resistance zone, they are horizontal, sloping, and dynamic. When trading with support and resistance, we tend to use break out as our strategy.
In trading breakouts, we have successful breakouts; the type of breakouts that the price completes its movement in the direction of the breakout, and a false break out; the type that the price doesn't complete its movement in the direction of the breakout. We also have strong and weak breakouts.
A trading strategy was applied using support & resistance. The strategy involves the use of RSI and Volume indicators along with support & resistance levels. The support & resistance along with the RSI gives us the trading signal, while the volume indicator helps to confirm the signal and give us the point of entry and exit.
