Basic EMA Strategy + Trend Line Break - Crypto Academy / S4W6 - Homework post for @lenonmc21 | by benjamin09


Theory.
1. Define and Explain in detail in your own words, what is the EMA Strategy + Breakout of the Trend line?
The EMA Strategy + Trend Line Break refers to a strategy used by traders to determine their point of entry and exit in the market of the currency(s). This strategy is brought to life through the use of two methods which are ; the EMA (Exponential Moving Average) and the Price Action technique of Trend Line Break.
The EMA(Exponential Moving Average).
This is an indicator which is accessed on any trading platform such as Trading view, and it gives the average movement of the price of the currency(s) depending on the timeframe selected to be used on the moving average indicator. It might be selected to use the latest changes and get the average of them or it can be selected in a long term standard in order to use the past prices of the currency to get the average.
With the EMA, it analyses the price and shows the analyzed data in the form of a line. When the line is below the candlesticks, this indicates an upward movement of price and when the EMA line is above the candlesticks, it indicates a downward movement of the price.Trend Line Break.
The Trend line break is a price action technique where the trader analyses the overall trend and uses small reverse trend lines in order to know when to place his trade from the break in the trend line.
For example, if the market is in a general uptrend, after analyzing the market, when there is small downward movement in the trend, the trader will place a downward trend line against this downward movement. When the candlesticks cross and go above the trend line, this indicates the buyer to buy the currency.
Now that we understand the EMA and Trend Line Break, we can understand the strategy of EMA + Trend Line Break and how to use it.
To use this strategy, the trader will first of all have to put in his EMA indicator in the 100-period timeframe. When he, puts it in the chart, he can now observe the overall market trend and then, he puts his trend lines in the reverse of the overall trend (for example, downward trend line if in an overall upward trend) and waits for the price or candlesticks to break the trend line and move in the opposite direction indicating a perfect entry position.
2. Explain in detail the role of the 100-period EMA in the EMA + Trendline Breakout Strategy?
When using the EMA indicator in the EMA + Trendline Breakout Strategy, we always put the timeframe to be in the 100-period because, at that timeframe, the EMA shows the average price of the currency in real time for the trader to be able to determine the trend type (whether bullish or bearish) as he makes his decision on whether or not to make a trade transaction.
Also, at the 100-period timeframe in the moving average, the trader gets the average change in price for a 100 day period thus giving the trader a long term trend, which if manipulated correctly, will give him sufficient profits.
The EMA indicator, when used in the Strategy of EMA + Trend Line Break, it determines the trend of the price for the 100-period timeframe thus giving the trader the information of whether the overall trend is bullish or bearish.
For example, if the EMA line is below the candle sticks and moving upwards, then the currency is an upward or bullish trend and if the EMA line is above the candlesticks, then the currency is in a bearish or downward trend.
3.Explain in detail the role of the "Trend Line" in the EMA + Breakout Strategy Trendline Breakout?
The Trend line is a part of the EMA strategy + Trend line break, and it is made up of trend lines that are placed following the price in the reverse trend of the overall trend determined by the EMA indicator.
For example, if the EMA determines the trend as a bullish trend, then therefore, the Trend line will be placed in a downward direction.
When the trend line is placed, the candle sticks are still moving in the opposite direction of the overall trend. The trader has not yet placed his trade. He is still looking for the perfect entry point. The perfect entry point is when the price or the candlesticks cross(break) the trend line and start moving in the direction of the overall trend which is already determined by the aforementioned EMA line.
For example, the EMA is in a bullish trend and the trend line has been placed downwards. Once the price breaks the trend line and starts moving upwards, the trader has to place a buy order and put his take profits and stop loss prices at equal distances.
4. Explain the step-by-step of what needs to be taken into account to execute the EMA + Trendline Breakout strategy correctly?
In order for a trader to successfully place a trade using the EMA + Trendline Breakout Strategy, the followingt steps will need to be followed.
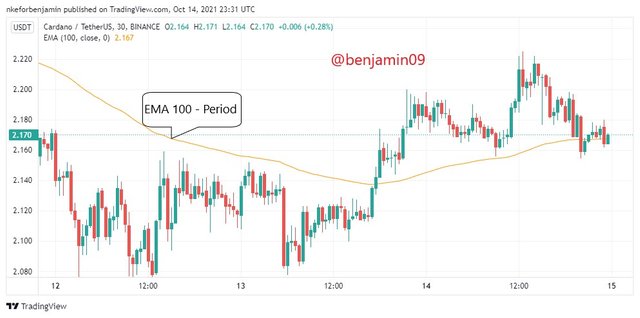
STEP 1 - EMA 100-Period.
The EMA indicator helps us to determine the trend of the price over the 1100 day period and with this data the trader can determine what direction he will trade. When the trend is bullish, he will eventually trade a buy and when the trend is downwards or bearish, he will trade a sell.STEP 2 - Market Structures and Cycles.
After inputting the EMA, the trader needs to now observe the market's structure and determine the cycle in which it currently is in. This implies that the trader should determine whether the market is in a bullish trend or a bearish trend. A bullish trend will occur when the price is above the EMA line and the bearish trend is when the price is below the EMA line. After getting the trend, the trader has to utilize a good prize structure by making "highs and lows" depending on the trend type. Higher and higher for bullish and lower and lower for bearish.STEP 3 - Trend Lines.
Once we have determined our market structures using our EMA, the trader will have to use the trend lines to determine the perfect entry point for trading. This is done by creating trend lines that are in opposite direction of the trend from the EMA line. This means that if the EMA trend is bearish, therefore, the trend line will be bullish and if the EMA trend is bullish, the trend line will be bearish.
5. What are the trade entry and exit criteria for the EMA + Trend Line Break strategy?
Entry criteria.
Before a trader makes the decision on entering a trade while using the EMA + Trend line break Strategy, he must have first of all, added the EMA 100-period to his chart. With this, he thus analyses the trend and determines the direction in which he will enter the trade. A buy order in case of a bullish trend from the EMA line and a sell order in case of a bearish trend from the EMA line.
With this information, he analyses the market structure to determine the highs and lows and if the price is just in a lateral position (negatively structured), the trader should wait for the trend. On the other hand, if the market structure is positively structured(highs and lows for whatever trend), then the trader should make his trend lines.
With the trend lines, once the price crosses the reversed trend and starts moving in the direction of the EMA's trend, the trader should enter the market and place an order depending on the trend. For instance, given a bullish trend from the EMA, the reversal trend is bearish and the price breaks the trend line which is moving downwards and starts moving upwards, the trader should enter the market with a buy order.
Exit criteria.
Once the trader decides to place his trade, he needs to enter his stop loss and take profit price level.
For the stop loss to be set, the trader should place it at the highest or lowest point the trend went given by the trend type. For example, if it was a downward trend, after the price started moving upwards, the stop loss should be the lowest point price reached in that trend and if it was an upward trend, after the price breaks and moves downwards, the stop loss will be the highest point during that upward trend.
The take profit will be placed in proportion to the distance as the stop loss such that, if the stop loss is 20% away from the price, the take profit should also be 20% away from the price.
Practical.
Make 2 entries (One Bullish and one Bearish) in any pair of "Cryptocurrencies" using the "EMA Strategy + Trend Line Break" (Use a Demo account, to be able to make your entry in real time at any timeframe of your choice, preferably low temporalities)
Bearish Trend.
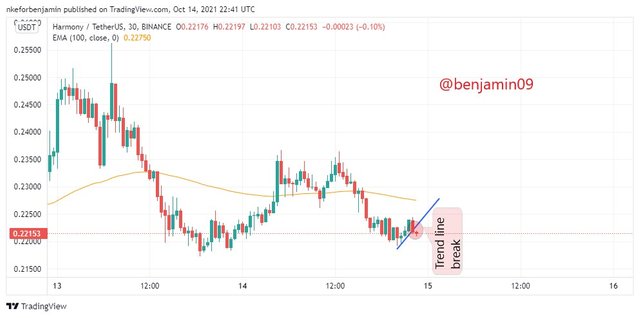
Firstly, I examined the market and the trend which is bearish by the EMA. I observed the upward movement in the price so, I placed my trend line that will indicate my perfect entry point.
And from the above image, the price just broke the trend line moving downwards.
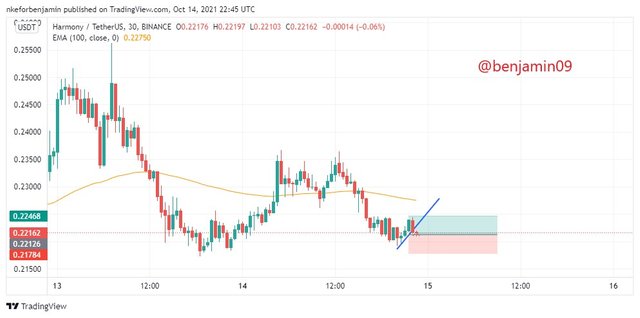
So, I measured my take profits and stop loss.
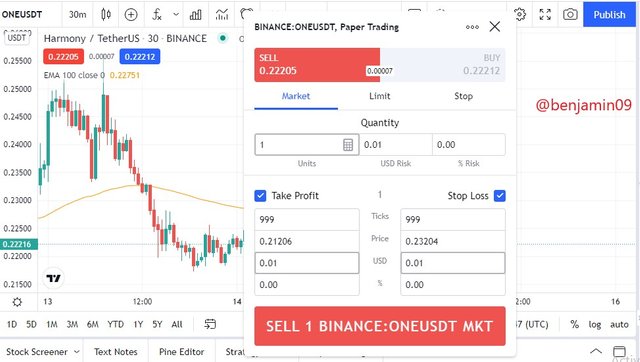
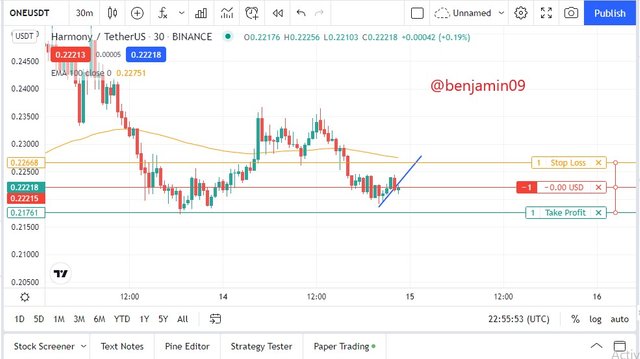
I have placed the sell trade with my stop loss and take profits for the currency pair ONEUSDT.
Bullish Trend.
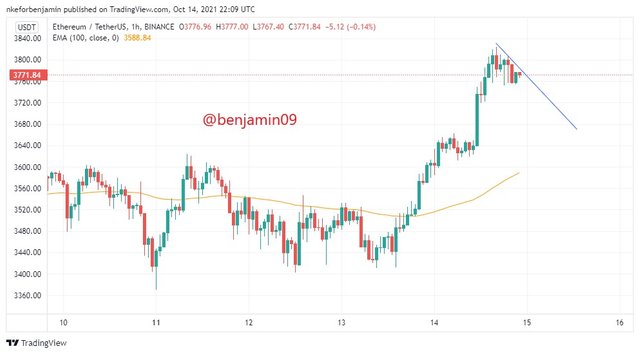
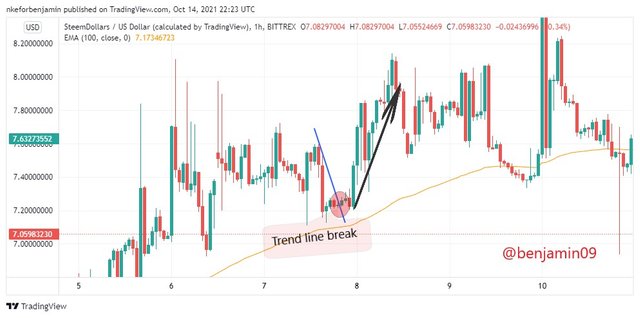
In the same light as the bearish trade, I observed the market trend and I noticed it was a bullish trend but the price was falling. So, I placed my trend line waiting for the break.
The trend line break happened later on. This is a perfect entry point for me into the market by buying.
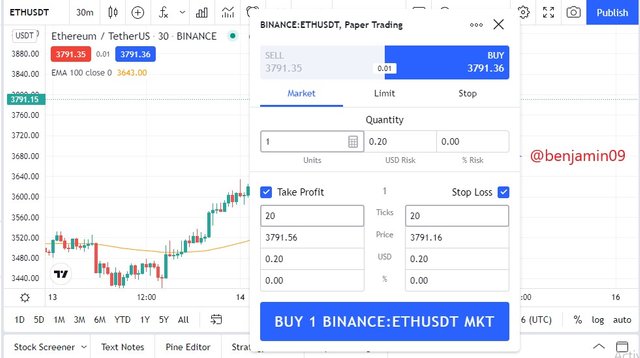
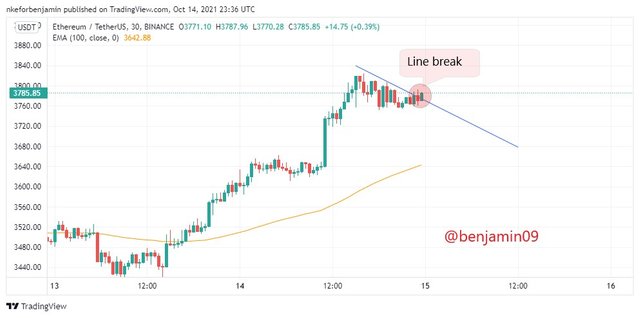
So I took while and adjusted my take profit and stop loss prices.
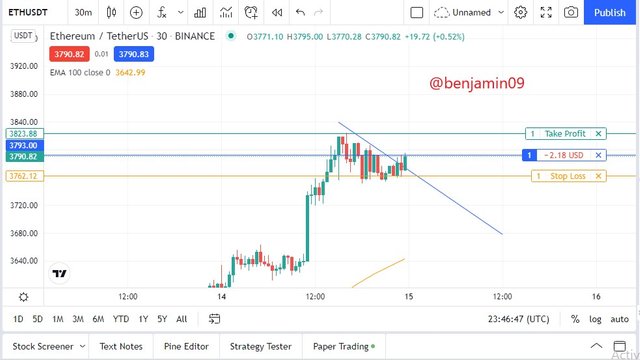
I placed my buy order for the currency pair ETHUSDT.
Conclusion.
After the completion of this homework task, I have become acquainted with the Price Action Strategy of EMA + Trend line break and I can use this information to carry out a live trade.
Thank you for reading.
Cc : Prof @lenonmc21