Trading Crypto with On-Balance Volume Indicator - Crypto Academy / S5W4 - Homework Post for @fredquantum.
Hello, welcome to Steemit Crypto Academy Season 5, Week 4.
It is another great chance to learn. Thanks to Prof @fredquantum.


In your own words, explain your understanding of On-Balance-Volume (OBV) Indicator.
Trading in the crypto market will become interesting and fun if you begin to make a huge amount of profit. Making a profit in the market requires a lot of skills to be learned, and you need to properly analyze the market. From studies there are two types of analysis in the crypto market, these include Fundamental analysis and technical analysis.
Today we will be looking at one type of technical analysis tool in the crypto market called the On Balance Volume Indicator which can also be called the OBV indicator. So what is the On-Balance-Volume indicator?
The On-Balance-Volume Indicator, Is a technical indicator it is was developed by Joseph Granville in i963, in his book the stock market books. In his book, he believed that volume has a great effect on the up and down movement of price in the market. After much study was done which brought the technical analysis tools indicator called the On Balance Volume Indicator.
The On Balance Volume indicator is a Momentum-based indicator that makes use of the injected volume in the market to predict the upward and downward movement of the price of an asset. With the presence of the injected volume, you will know when to buy or sell in the market. Traders make use of the OBV indicator to predict price movement and if they know where the price is about to go, then they will make a lot of profit because they are using the OBV indicator.
If there is a high volume of an asset, there will be more buyers in the market and this will, in turn, cause the price of the asset to go up or to be in an uptrend. But when sellers are more than buyers in the market, the asset is usually evenly distributed. The asset at that time has more selling value because the price of the asset is in the highest range, this will cause a continuous falling of the price as the selling volume is being injected. This will lead to a downtrend of the price.
This is an example of the On Balance Volume Indicator below.
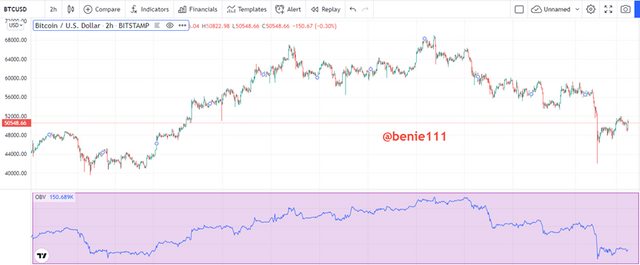 Image source
Using any charting platform of choice, add On-Balance-Volume on the crypto chart. (Screenshots required).
I will be using the Tradingview on my laptop, using the trading view on my browser from the site tradingview.com. These are the steps that are required in other for you to add the On Balance Volume Indicator..
- Step 1: Enter the website at www.tradingview.com. The screenshot is gotten from trading view.com.
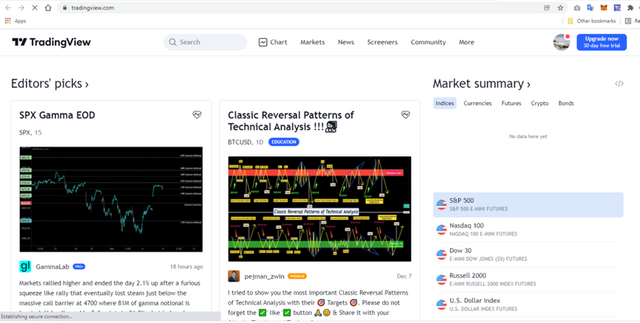 Image source
- Step 2: Select the chart at the top
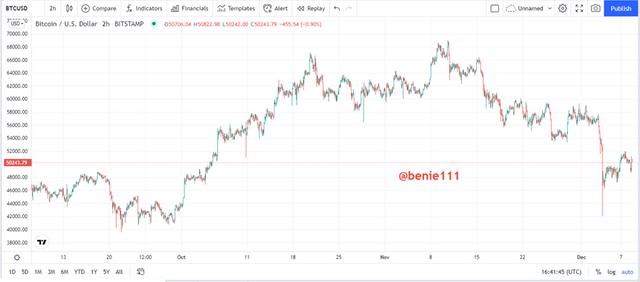 Image source
- Step 3: Then click the Indicator icon, then search on the search bar, On Balance Volume Indicator
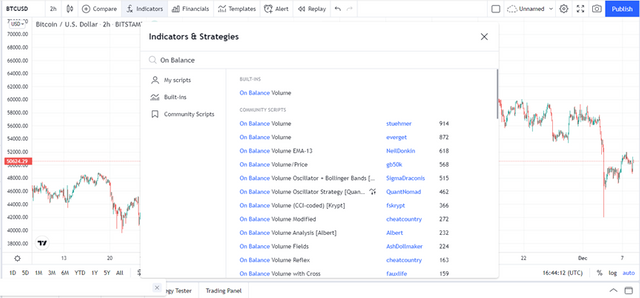 Image source
- Step 4: Then it will automatically pop up as a new window
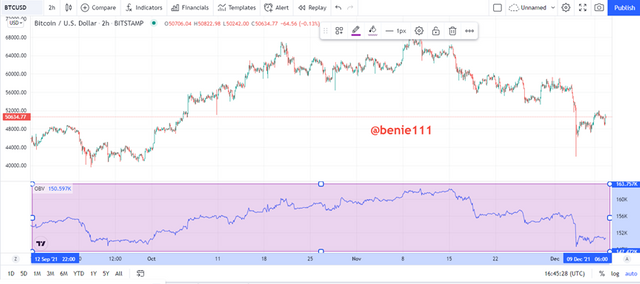 Image source
What are the Formulas and Rules for calculating On-Balance Indicator? Give an illustrative example.
To calculate the On Balance Volume Indicator, these equations are used
OBVCurrent = OBVprev + Volume ….(equ I)
OBVcurrent = OBVprev + 0 …..(equ ii)
OBVcurrent = OBVprev - Volume……(equ iii)
This is the explanation of the following formulas that are above
- In the first equation, the closing price of the current candlestick is greater than the previous closing price, then you can use the equation
- The second equation, the closing price of the current price is equal to the previous closing price, then you can use the equation
- The third equation, the closing price of the current price is lesser than the previous closing price, then you can use the equation
An illustration of the On-Balance-Volume (OBV) Indicator.
From the table below, we can see the 7 days amount of Closing prices and volume of a particular asset and we will use it to calculate the On-Balance-Volume Indicator
| Closing Price | Volume |
|---|---|
| $30 | 45,000 |
| $35 | 55,000 |
| $33 | 43,000 |
| $40 | 46,500 |
| $40 | 47,900 |
| $32 | 51,000 |
| $46 | 50,000 |
In the calculation, we will be using the Formula below
OBV = OBVprev + Volume …………….(I)
OBV = OBVprev + 0 ……………………..(ii)
OBV = OBVprev - Volume ………………(iii)
The calculation ca be seen below
- DAY 1: OBV = 0 + 0 ( this is because there is no previous volume or OBV)
OBV = 0 - DAY 2: OBV = 0 + 55,000
OBV = 55,000 - DAY 3: OBV = 55,000 - 43,000
OBV = 12,000 - DAY 4: OBV = 12,000 + 46,500
OBV = 58,500 - DAY 5: OBV = 58,500
- DAY 6: OBV = 58,500 - 51,000
OBV = 7,500 - DAY 7: OBV = 7,500 + 50,000
OBV = 57,500
On the Seventh Day from the calculation the On-Balance-Volume calculation we got an OBV of 57,500
There was an addition on the following days: Day 2, Day 4, and Day 7 this is due to the increment in price. There was subtraction on the following days Day 3 and Day 6, there was a reduction in the volume due to the decline of the price and the OBV was the same on the Fourth and the Fifth Day because both prices are the same.
What is Trend Confirmation using On-Balance-Volume Indicator? Show it on the crypto charts in both bullish and bearish directions. (Screenshots required).
On Balance Volume indicator can also be used to confirm trends in the market. This is one crucial important function of the OBV indicator. How do we use the OBV indicator to confirm the trends of the price in the market?
Bullish Trend Confirmation:
We can use the OBV indicator to know the current trend of a price in the market, at the screenshots below, we can see that the On Balance Volume indicator is producing higher highs and higher lows which signifies an uptrend, we've decided to check if it corresponds to what I have on the price chart and unfortunately the price was corresponding to the volume. From this, we can dictate the Bullish trend using the On Balance Volume indicator.
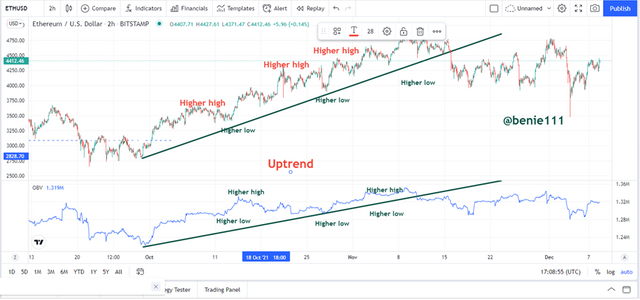 Image source
Bearish Trend Confirmation:
Also, we can use the On Balance Volume Indicator to confirm the Bearish trend in the market. On the OBV indicator, if the line is producing lower lows and lower highs, which also shows a downtrend, this means that the current price trend is on a bearish trend. The shows that there is a high amount of the sell volume at that point in the market. From the screenshot below you can see that as the OBV indicator is showing us a downtrend movement of the volume, it is also reflecting on the price on the chart. this is a wonderful relationship between the price and the volume of the assets using the On Balance Volume Indicator. This can be seen from the chart below.
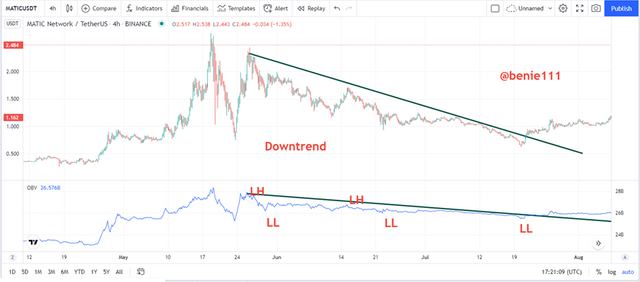 Image source
What's your understanding of Breakout Confirmation with On-Balance-Volume Indicator? Show it on crypto charts, both bullish and bearish breakouts (Screenshots required).
The On Balance Volume indicator does another powerful job in the market, it can also be used to confirm Price Breakout in the market. This breakout is for both the bearish and bullish move of the price. How can this be done? Let take a look at both of them.
Bullish Breakout Confirmation.
Sometimes the price normally consolidates during a trend, this is done to gain more momentum, to either continue the trend or start a reversal movement to the opposite direction.
How can we confirm a Bullish breakout, the Ranging market is usually bounded by the support and resistance, and you will also draw the support and resistance line on the On Balance Volume indicator, once the OBV line breaks through the resistance, and the OBV starts moving in the upward direction, it is a clear indication of a bullish breakout. An example can be seen below.
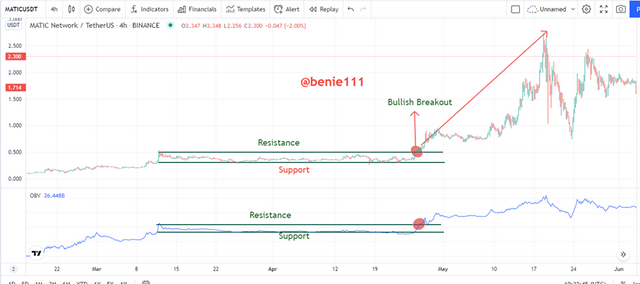 Image source
Bearish Breakout Confirmation.
Sometimes the price normally consolidates during a trend, this is done to gain more momentum, to either continue the trend or start a reversal movement to the opposite direction.
How can we confirm a Bearish breakout, the Ranging market is usually bounded by the support and resistance, and you will also draw the support and resistance line on the On Balance Volume indicator, once the OBV line breaks through the Resistance, and the OBV line start moving downwards, it is a clear indication of a bearish breakout. An example can be seen below.
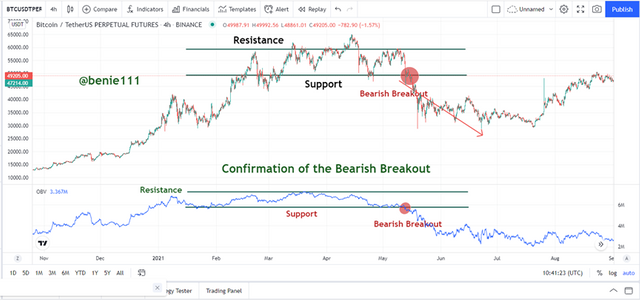 Image source
Explain Advanced Breakout with On-Balance-Volume Indicator. Show it on crypto charts for both bullish and bearish. (Screenshots required).
Another thing is that the On Balance Volume Indicator can be used to confirm an advance breakout. Advance breakout is the breakout that occurs on the On Balance Volume Indicator before it occurs on the price chart. This is another wonderful feature of the OBV indicator. This can be done on both the bullish and bearish advanced breakout. Let do some explanation on them.
Bullish Advanced Breakout
This breakout occurs on the On Balance Volume Indicator, toward the up direction, but on the price chart, it has not crossed the previous higher high, the Advance breakout occurs, on a higher high that is lower than the previous higher high. This is a very good opportunity for buyers to explore the market and execute the buy order, and you will gain more using this strategy. This advance breakout shows that the price asset will definitely rise above the previous high. Traders can use it as an early entry point to make a good profit
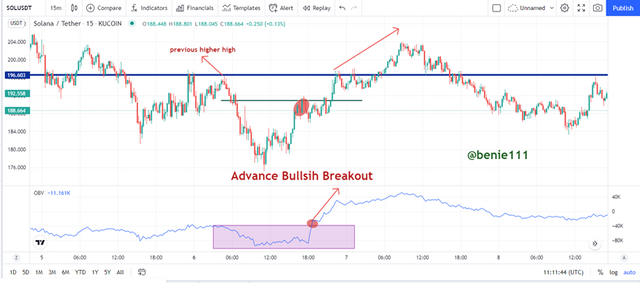 Image source
Bearish Advanced Breakout
This breakout occurs on the On Balance Volume Indicator, toward the down direction, but on the price chart, it has not crossed the previous lower low, the Advance breakout occurs, on a lower low that is higher than the previous lower low. This is a very good opportunity for sellers to explore the market and execute the sell order, and you will gain more using this strategy. This advance breakout shows that the price asset will definitely go below the previous low. Traders can use it as an early entry point to make a good profit. This chart that shows the bearish advance breakout can be seen below.
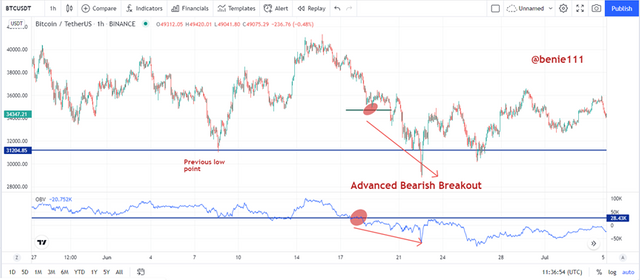 Image source
Explain Bullish Divergence and Bearish Divergence with On-Balance-Volume Indicator. Show both on charts. (Screenshots required).
You can also use the On balance volume indicator to find both Bullish and bearish divergence on the price of assets in the market.
Bullish Divergence:
Divergence is used to form a new trend in the market, for bullish divergence the trend is being from a bearish trend to a bullish trend. The OBV indicator forms a lower low and a lower high while in the price chart you will see a lower high and a lower low which causes the trend to change to a bullish trend, Buyers mostly look out for the bullish divergence so they can make use of this opportunity and make a reasonable amount of profit. Look at the chart below for more understanding.
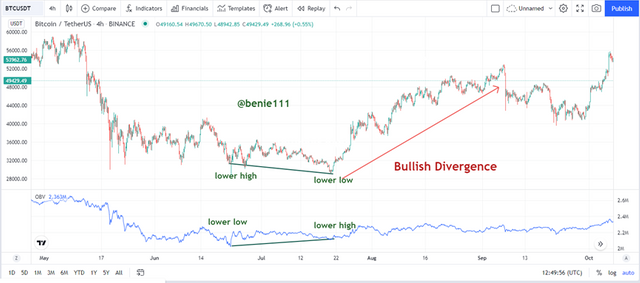 Image source
Bearish Divergence:
Divergence is used to form a new trend in the market, for bearish divergence the trend is being changed from a bullish trend to a bearish trend. The OBV indicator forms a higher high and a higher low while in the price chart you will see a higher low and a higher high which causes the trend to change to a bearish trend, Sellers mostly look out for the bearish divergence so they can make use of this opportunity and make a reasonable amount of profit. Look at the chart below for more understanding.
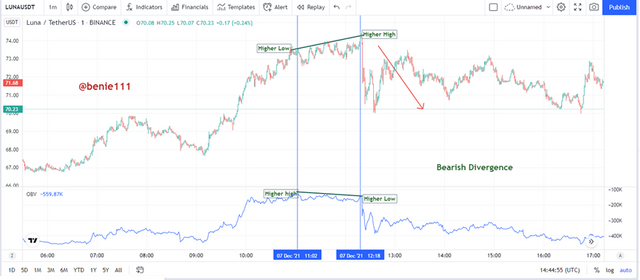 Image source
Confirm a clear trend using the OBV indicator and combine another indicator of choice with it. Use the market structure to place at least two trades (one buy and one sell) through a demo account with proper trade management. (Screenshots required).
In this question, I will be combining the On Balance Volume indicator with the Stochastic Oscillator,
The Function of the OBV indicator is to confirm the price trend while the Stochastic indicator will be used to determine the entry point of the price.
I have explained how to use the OBV indicator to determine the trend of the price in the market, now let's use it to determine a good entry point using the stochastic oscillator indicator. The Stochastic oscillator has basically 2 regions, the overbought region which is from 80 -100 level while the oversold region is from the 0 -20 level. The Overbought region simply tells you that the buyers are tired and sellers are taking over the market, so it is the best time to sell while the oversold region tells us that the sellers are now weak and buyers are taking over the market, so this is the best time to buy.
Buying Trade:
We can see that the OBV indicator has shown us an uptrend and the stochastic indicator is at the oversold region, so it is the best time to buy. So I bought using a risk to reward ratio of 1 :1 to place both stop loss and take profit.
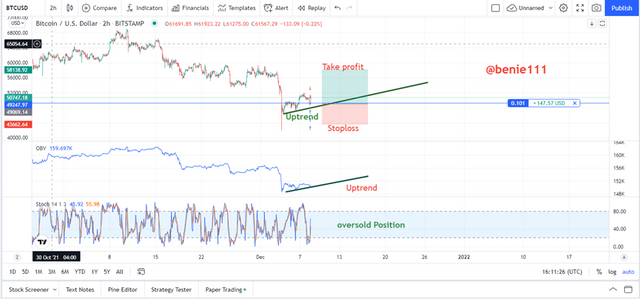 Image source
This is the result of the trade that I took.
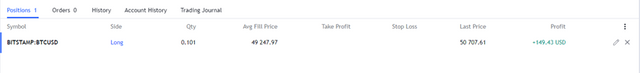 Image source
Selling Trade:
We can see that the OBV indicator has shown us a Downtrend and the stochastic indicator is at the overbought region, so it is the best time to sell. So I bought using a risk to reward ratio of 1 :1 to place my both stop loss and take profit.
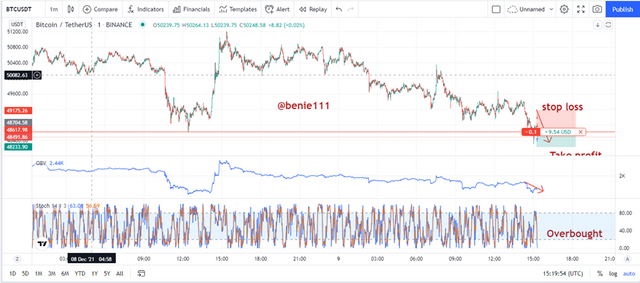 Image source
You can see the result below
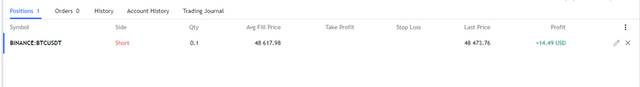 Image source
What are the advantages and disadvantages of On-Balance-Volume Indicator?
Advantages of On Balance Volume Indicator
- The On Balance Volume Indicator can be used to indicate or know the trend of the price of an asset in a market.
- The On Balance Volume Indicator, shows us how we can use the volume of assets to determine the price of the asset, it shows the relationship between volume and the price.
- The OBV indicator, is very easy to read, use and understand, anyone can use it, even if you are new in the crypto market.
- The OBV indicator can be used for different markets, even in the forex, stocks, and even crypto, and even in any time frame.
- It can be used to confirm breakout on the price chart
- Even the OBV indicator can perform an Advance breakout of the price of an asset in the market.
Disadvantages of On Balance Volume Indicator
- This OBV indicator is a leading indicator, sometimes produces a false signal
- The OBV indicator is mostly combined with other indicators because it is not that accurate.
Conclusion
The On-Balance-Volume Indicator is a wonderful indicator, which can be used to determine the trend of the price, confirm the break, confirm the advance breakout and also determine the Divergence of the price in the market.
Basically, the OBV indicator shows the relationship between the Price of the asset and the volume of the asset. It is a wonderful indicator that anyone can use, very easy to use and understand, maybe you can also give it a try today.