Crypto Academy / Season 3 / Week 3 - Homework Post for Professor @lenonmc21
Define in your own words what is a "Trend" and trend lines and what is their role in charts?
ANSWER
A trend can be defined as a graphical visualization of the relationship between buyers and sellers in a cryptocurrency market. This indicates how active the market is, and how the traders influence the price of a coin through their psychological state of mind.
Due to the high volatility characteristic of the cryptocurrency market, and to determine or forecast what future move of the price of a cryptocurrency might be, then it will be of great advantage to know how trend works in cryptocurrency technical analysis.
The trend shows how the price of a coin has moved at a given time frame through to another defined time.
Trends can be in different forms
Upward trend: This is when the price of a coin takes a move from a lower position upwards, which indicates that the price is going up: There is a high demand of the cryptocurrency than the supply, and it can be term as a bullish trend
Downward trend: This is when the price of a coin takes a move from a higher position downwards. This indicates that the price of a coin is falling: There is a higher supply of the coin in the market than the demand. This can also be term as a bearish trend.
Sideways trend: This is when the price of a coin doesn't really go up, neither does it have a downward continuous move. This interprets a sort of balance between the demand and supply of a coin during a specific time frame
Define trend lines
Trend lines can be defined as horizontal lines that connect two or more trend points together to give cryptocurrency analytical market chat a more meaningful picture. Trend lines complement and give in-depth meaning to trending moves of a cryptocurrency price during a specific time frame.
The role of trend lines in charts?
- Trend lines are used to predict the future price of a cryptocurrency
- Trend lines gives more interpretations to trending points
- Trend lines visualize how the price of a coin has relatively increases or decreases
- It interprets the relationship between demand and supply.
Explain how to draw an uptrend line and a downtrend line (Show a screenshot of each).
ANSWER
How to draw an uptrend
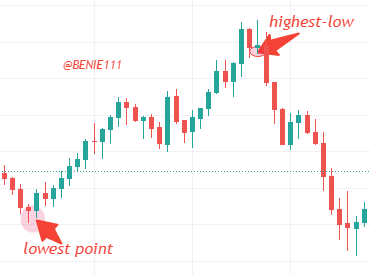
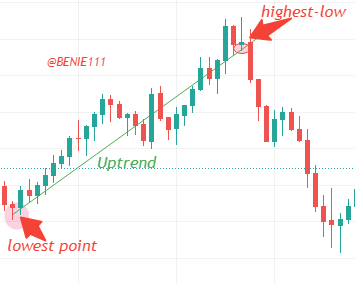
An uptrend, which is also known as a bullish season is a line that connects a relatively highest-low point together with the lowest point. The least of these two points must be connected in a single line to make the uptrend line chart a clearer one
How to draw downtrend
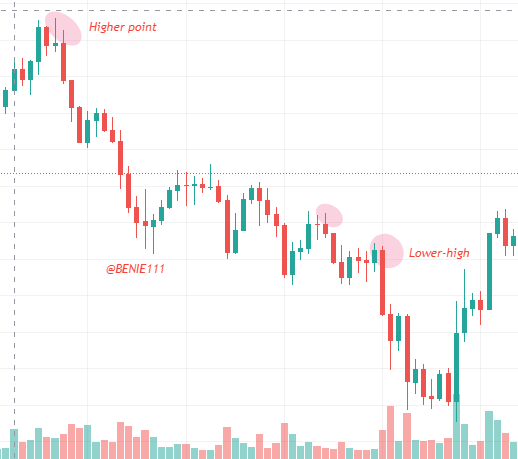
A downtrend, which is also known as a bearish season is a line that connects a relatively higher point with the lower-high point. This pictures various decreases in price from highs to low, which tactically interprets a downtrend
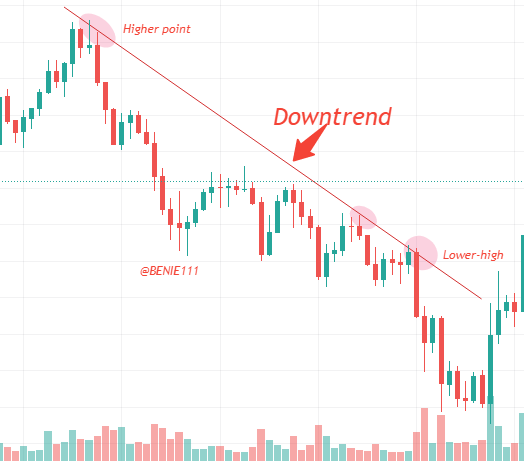
Screenshot taken from coingecko trading view

Define in your own words what "Supports and Resistances are and how we can identify both zones (Show a screenshot of each one).
ANSWER
Support
Support can be defined as a temporary barrier at a certain price that is located at the lowest price level of an asset at a given period. This is a position where buyers like to take advantage of as an entry point because, at that point, the price is very low. this buying pressure makes it difficult for the price to go below this support line, and more pressure from buyers might eventually result in higher demand, and in return, it will bring the price to an upward movement, However, if the price falls further below this temporary barrier known as the support level, this means the selling pressure overrules the buying pressure in the market, and that will lead to a more downward movements
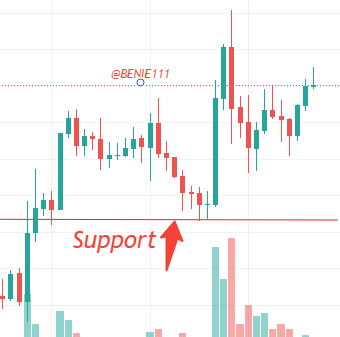
Screenshot taken from coingecko trading view
Resistance
Resistance can be defined as a temporary barrier at a certain price that is located at a top-level where the price has not gotten to, or where the coin seems to be overvalued. This region becomes a barrier which the price finds very difficult to cross and go beyond. At this point, many traders who have bought this asset will be willing to take the opportunity of the high price and benefit from the market situation. These will increase the selling rate and eventually, this might result in a downward movement of the price. However, if the selling pressure could not overrule the buying rate, the price might continue an upward movement and result in the price breaking this resistance temporary barrier in a continuous bull run.
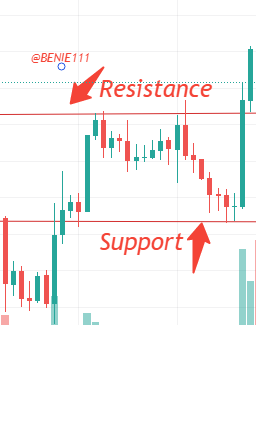
Screenshot taken from coingecko trading view
Explain in your own words at least 2 simple chart patterns with screenshots.
ANSWER
Descending Triangles:
This is a chart pattern that is formed through a downtrend from higher price points meeting the support level. This is a result of traders who sells happen to sometimes lose the market to buyers subsequently during the downtrend move, and this is reflected in the price trend and form a support level that the downtrend move later meets to form a triangle.
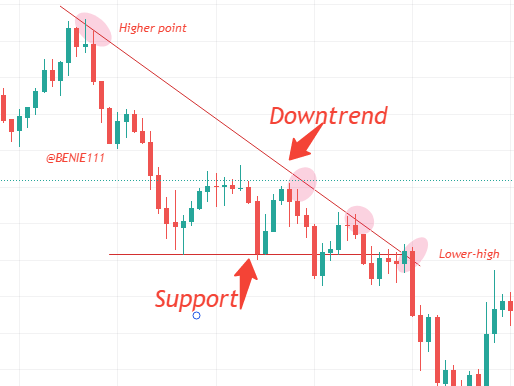
Screenshot taken from coingecko trading view
Double Roof:
This is a chart pattern that ended up in "M" shape which is created by two successive almost equal or equal peaks, with the first peak which formed after a protracted upswing, and falls back from the resistance level to a newly created support level, and from there, bounced to the resistance level to form the second peak, and then falls back to the support level.
this pattern reflects a reversal pattern and then leads to a bearish move by breaking the support level.
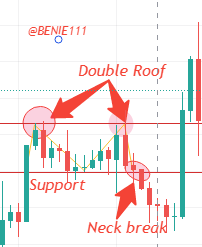
Screenshot taken from coingecko trading view
Conclusion
The importance of trends and trendlines can no be overemphasized in the technical analysis, they are proven to be useful tools. It must be well understood to avoid getting wrong signals, as they show the relationship with the demand and supply with a given time frame.
Chart patterns can be used to forecast future market moves and to make decisions for entry and exit points, therefore, it is an important part of technical analysis too that should be understood.
Cc: @lenonmc21