Crypto Academy / Season 3 / Week 2 - Homework Post for Prof @reminiscence01
Explain the Japanese Candlestick Chart? (Chart screenshot required)
Answer
What is a Chart?
Charts are a type of technical analysis tool that is used to show a metaphorical illustration of price movement, or to follow price dynamics in a financial market over time. Traders typically utilize them for fast trading and short-term market activity. Though investors utilize these tools on occasion, they prefer fundamental analysis most of the time to help in making long term financial decisions.
Candlestick method was agreed to be the most informative kind to use on a chart.
Candlesticks are useful in planing trades and tracking of trend direction changes.
For efficiency of candlestick chart, you'll need the understanding of the open, close, lowest and highest values for each time period you'd like to explore on the chart.
What are Japanese candlesticks
The Japanese candlesticks method began when Japanese traders Munehisa Homma employed it to sell rice because it aids in market analysis during the seventeenth century.
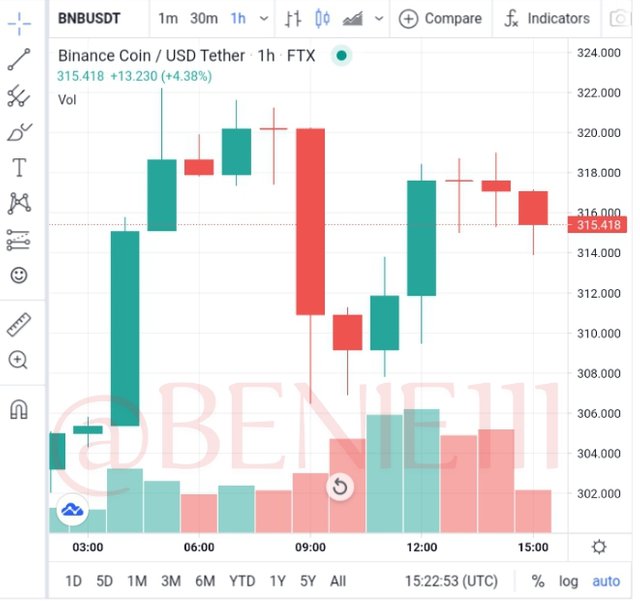
The Japanese candlestick chart previews how the asset price has changed over time. This is a visual representation of the opening and closing prices, as well as the high and low prices, for a specific time period. The Japanese candlestick chart is more instructive and informative than the known line chart, which only shows the price of the most recent deal for a given period.
This candle is made up of a body and shadows, often known as wicks. The body depicts the price's journey from the beginning to the end of the time, i.e., this is " from the first transaction through to the last deal." The shadows represent the minimum and maximum price values that the asset has attained.

Describe any other two types of charts? (Screenshot required)
Answer
Line chart
The line chart, which shows the close spots over a period of time which is connected by only one single line, can be said to be a classic chart
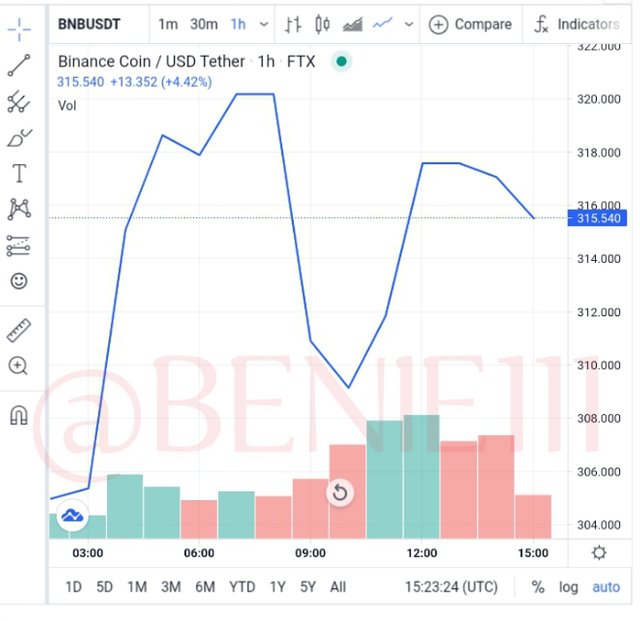
Despite its easy composition, traders should not expect enough helpful stuff from such a strategy. Because basic information regarding the range of price changes will be unavailable, the only thing he will be able to analyze is the closing price for a specific period.
He will also be unable to visualize the price's lows and highs during for that day, and also the opening price will remain unknown when utilizing this line chart.
Bar Chart
In comparison to a line chart, a bar chart is far more informative.
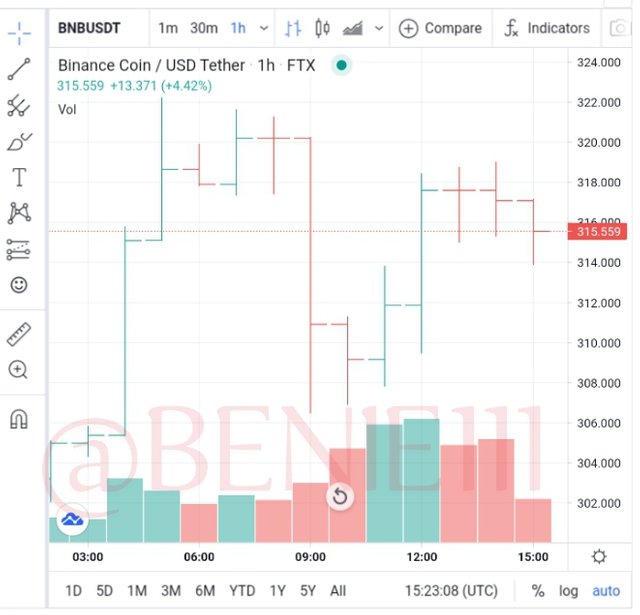
Bars are vertical lines that represent how much the value of an asset has declined or increased over time.
To comprehend the bar chart, four major indicators must be noted:
- The open price
- The close prices
- The minimum price
- The maximum price
The Open and Close prices are indicated by a horizontal bar with short lines.
By simply looking at a bar chat, a trader can quickly gain a clear picture of how the price of a cryptocurrency has evolved over time.
Traders can see the difference between the opening and closing prices with a bar chart, which is one of the feature that line chat does not provide.
When determining the moment of market consolidation, the bar chart can be well a utilized tool.
This chart, however, is not very useful for short-term time spans.
In your own words, explain why the Japanese Candlestick chart is mostly used by traders.
Answer
Candles are a great source of information. They provide traders with precise essential data that is critical to their market activities. If we are just engaged in trading for 1-4 hours, the flow of useless information is shut off, leaving us with just the necessary.
The Japanese Candlestick is a useful tool for displaying fluctuations. It may appear complicated at first, but after a while, the trader recognizes the value of convenience and simplicity.
Prevalence of Japanese candlesticks, which are the most widely used and popular across all terminals. As a result, most traders who utilize technical analysis have become accustomed to it.
Candlestick predicting has been around for centuries and is well-known for its accuracy. It allows traders to work at a high level of efficiency for a set length of given time.
Japanese candlesticks can help you comprehend what emotions are prevalent in the market when it comes to a cryptocurrency's future potential which happens to open opportunity for traders
Describe a bullish candle and a bearish candle identifying its anatomy? (Screenshot is required)
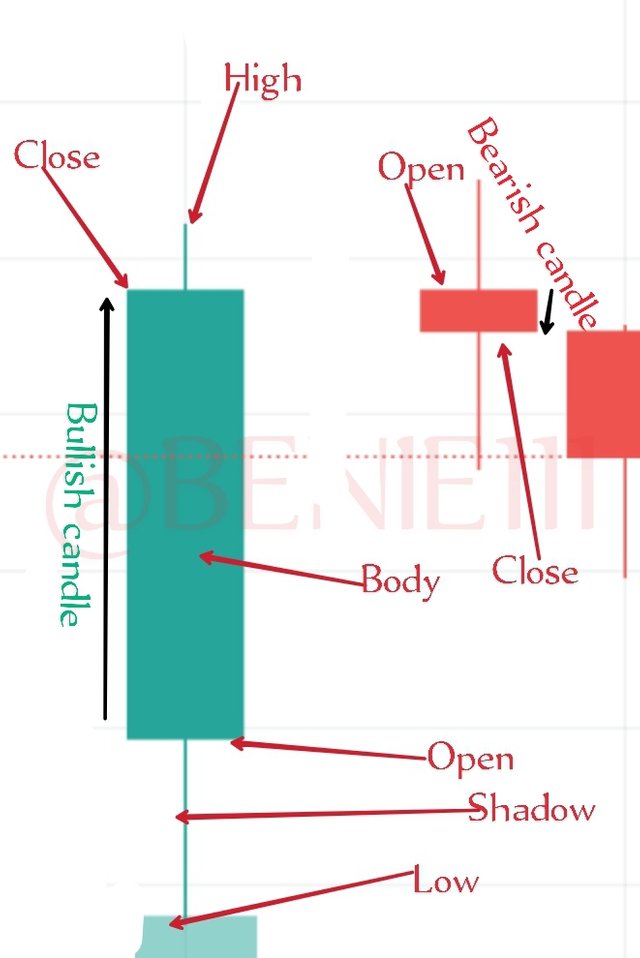
Candle opening level: This is the market price value at the time the candlestick began to develop. It is the level where the candle's body starts building. This value remains the same until the specified time period finishes and it closes.
Candle closing level: This is the value of the candle's price value at the end of its body's form. The body can possibly change during the process, becoming smaller, and larger, while the candle is not yet closed.
Lowest price: It depicts the price's decline during the candle forming process. That instance, the price fell to a specific low point before rising. The shadow will indicate how far the price has fallen.
Highest price: It indicates an extreme, similar to the preceding signal, where the price went at a certain point in time: The highest value.
Other noted makeups of the candlestick
- The body: This previews the distance between the Open price level and the close price level. This is a boldly colored area of the candles and it expresses the candles moment momentum.
- The shadow or wick: This indicates the unsettled level that the asset price went where the candle could not close
CONCLUSION
The Japanese Candlestick is a great tools in using a chart while conducting a technical analysis on a particular asset, and it is known for its efficiency, effectiveness and informative features. However, users need to understand the basic indicators ( The open and close price level, the highest and the lowest level) for the chart to be used at it's best.
Thanks to Prof @reminiscence01 for this week's lecture