Crypto Academy / Season 3 / Week 1 - Homework Post for @kouba01
What is the Ichimoku Kinko Hyo indicator? What are the different lines that make it up? (screenshots required)
ANSWER
What is the Ichimoku Kinko Hyo indicator?
The Ichimoku indication is too complicated for many new traders, thus they don't use it in their trading. This impression is formed by the instrument's five lines running simultaneously, generating different levels and zones.
The Ichimoku indicator was devised far earlier than others, in the 1930s, by Japanese trader and analyst Goichi Hosoda.
"Looking at the chart in equilibrium" is what Ichimoku Kinko Hyo means.
The KUMO, which is referred also to as CLOUD, is an outstanding feature of this indicator.
Traders can use the Ichimoku indicator to determine an asset's trends and price movement, as well as how the price comes to a balance over time before continuing on its trend.
The Ichimoku Kinko Hyo technical indicator is used to identify support and resistance levels, as well as market trends and buy and sell signals. On daily and weekly charts, even on minutes charts, this indicator will work perfectly and effectively on them.
The Ichimoku indicator's features
It shows the price changes in greater depth than a normal candlestick.
It can be used to predict future levels of support and resistance.
It provides a quick overview of the market, indicating the market's trending strenght, the momentum, and trend direction.
The indicator is most useful in trending markets and is less useful in markets that are trading sideways.
The Ichimoku Kinko Hyo is best employed when trading with the trend rather than against the trend.
When a trend is missing, the Ichimoku Kinko Hyo alerts the trader to wait for a trend signal before going into trading.
The Ichimoku indicator:
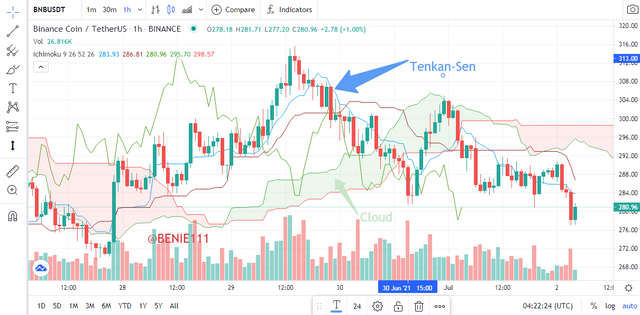
- Tenkan-Sen: It is a quick line that displays the average price value in a given range. The word "conversion line" appears in the literature, and that is exactly what it is.
The tenkan-sen is a faster line that reflects price volatility. It is calculated over 9 periods by adding the highest high and lowest low, then split by two. This line can be used as a support and resistance line or as a signal line for probable trend reversals. It's bright blue in color.
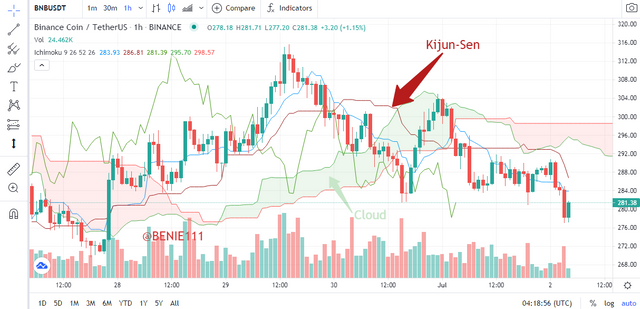
- Kijun-Sen: The calculating principle is the same as Tenkan, but it is utilized over a far longer period and reacts more slowly, therefore it is often dubbed a slow or delayed track.
The kijun-sen is a slower brown line that indicates volatility in long term prices. Baseline is another name for it. During the last 26 periods, the figures are calculated and the highest and lowest sums are split by two. It can be used to initiate the trailing stop loss, also to note trend shifts, and reflect support and strength levels.
Senkou Span A: This line is the midway distance of the Kijun-Sen, Tenkan-Sen, but the Kijun-Sen period shifted it forward. There are 26 Japanese candlesticks in the default settings. It is deemed bullish if the senkou span A sits at the cloud's top. Senkou Span A is teal green in color
Senkou Span B: The color is represented in pink. It is derived as the average price value for the 52-period, which is the indicator's longest period and it is also the heaviest line. It also shifted forward by the Kijun-Sen period's duration. The cloud is always ahead of schedule as a result of this move.
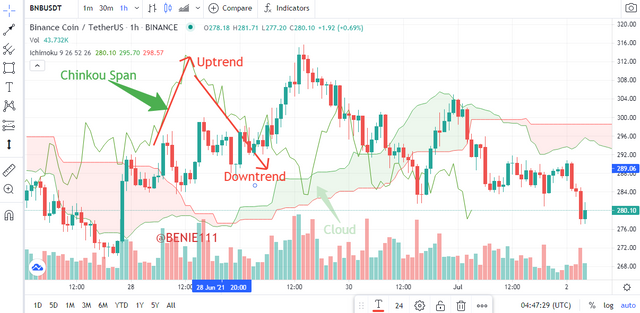
Chinkou Span: The line is a copy of the chart, but the Kijun-Sen period has shifted it back. It's also known as a delay line because it shows the price movement of closing values for the previous 26 periods. It's used to validate patterns from other lines. It is also referred to as The trailing span, which is usually a green line.
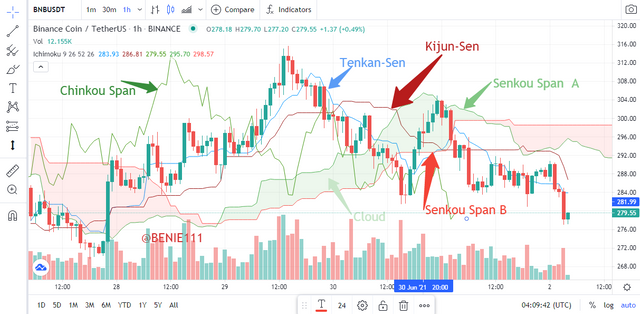
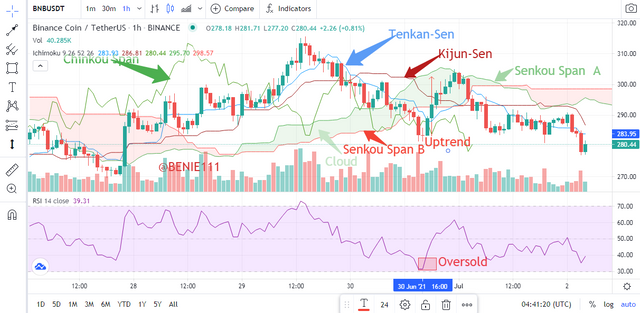
The Ichimoku indicator Chart pattern

How to add the Ichimoku indicator to the chart? What are its default settings? And should it be changed or not?(screenshots required)
ANSWER
From the Tradingview Chart page, click on the Indicator icon.
Look for Ichimoku Cloud from the dropdown lists of indicators. click on it
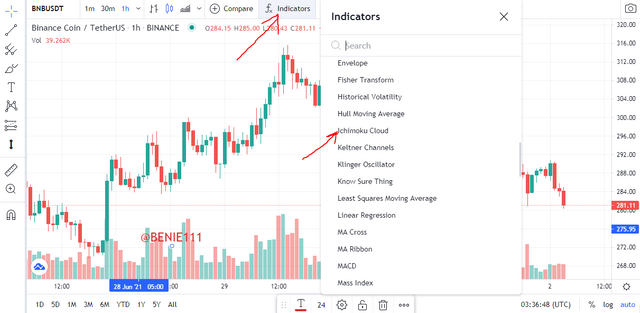
The Ichimoku indicator activation
Cancel the indicators dropdown to fully access the chart page.
You'll discover that the Ichimoku indicator has been added.
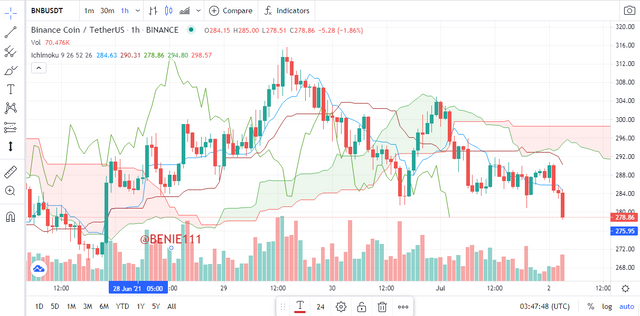
The Ichimoku indicator activation
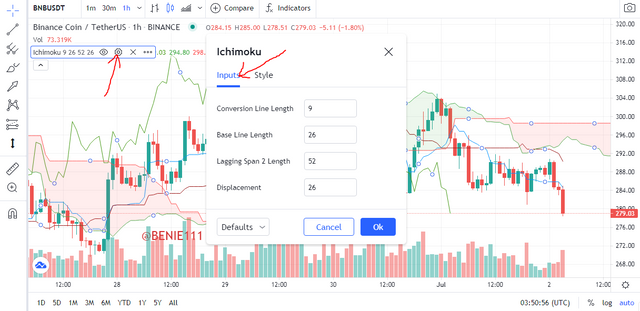
What are its default settings?
Inputs
These are default parameters under inputs, which was originally fixed by the inventor himself to enhance the effectiveness of the indicator
Chikou Span- 26.
Kijun Sen- 26.
Tekan Sen- 9.
Senkou Span B- 26.
Senkou Span A- 52.
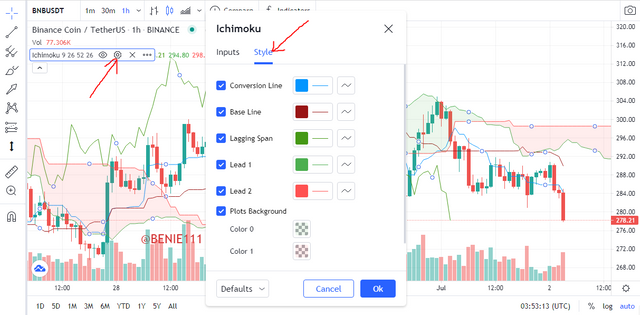
Style
This is another default setting which takes care of all the indicator's line and their colors. Traders may change these colors and they deem fit, and they can exclude any of the indicator lines.
Should Ichimoku indicator default settings be changed or not?
Goichi Hosoda believes that the default parameters of 9, 26, and 52 are adequate for achieving desired Ichimoku results. The 9 is a week plus half, and the 26 was the Japanese business month, while the 52 stands for two business months. Sundays, on the other hand, are not included in the calculations.
The default values are great, but I believe that if you change them, you're curve fitting for the instrument, the environment, and or time period. It's possible that the outcome will be hearth breaking. And this action may result in trade losses.
How to use the Tenkan Sen line? How to use the Kijun Sen line? And How to use them simultaneously?(screenshots required)
ANSWER
How to use the Tenkan Sen line
With Tenkan-Sen. We're looking for short-term price movement, a reversal or a minor trend. It is determined as the first median interval divided by two using the formula (High + Low) ÷ 2. By default, 9 calculation periods exists; the larger the sloppy move, the short-term trend becomes stronger; it also serves as a conventional support or resistance level, with its breakout serving as the initial reversal signal.
How to use the Tenkan Sen line
How to use the Kijun Sen line
Kijun-Sen. The main component of the Ichimoku indicator, it indicates the long trend's direction. If the market trend rises above the line, the uptrend is likely to continue, and you should observe the point to buy assets; if it falls below the line, the downtrend movement will continue, and then, consider to sell. It has a period of 26 and is a moving average. The new period is only changed when the default is changed (Maybe 3 times larger than Tenkan Sen)
How to use the Kijun Sen line
How to use Tenkan-Sen and Kijun-Sen simultaneously
When the Tenkan-Sen and Kijun-Sen are combined, they provide a clear view for the trader, indicating the best position to exist and the optimum moment to start trading.
When the Tenkan-sen line crosses the Kijun-sen from below to above, a definite purchase signal is formed, and when the Tenkan-sen line crosses the Kijun-sen from top to bottom, a clear sell signal is generated.
Combining the two indications is straightforward, and it tends to be more effective and yields better results.
What is the chikou span line? And how to use it? And Why is it often neglected? (screenshots required)
ANSWER
The Chikou Span is calculated by comparing the current closing price of an asset to the price of that asset over the preceding 26 periods. It's like a stock market version of "Back to the Future". When the price is above where it was in the preceding 26 periods, the market is bullish, and when it is below, the market is bearish. This is the Ichimoku Cloud's lagging span.
How to use the Chikou Span
How to use chikou span line
Chikou Span represents the current candle's closing price, moved back by the value of the second time interval. The distance between the Senkou lines is known as cloud on the chart and is hatched in a distinct color. The market is termed non-trending if the price is sits between these lines, and the cloud's edges positioned as support and resistance levels.
A purchase signal is generated when the Chikou Span line crosses the price chart from the bottom up. If the price drops from top to down to the bottom, that is a sign to sell.
If the price is below the cloud, the lower line represents the first resistance level, while the higher line represents the second;
If the price is above the cloud, the upper line of the cloud serves as the first support level, while the lower line serves as the second support level.
Why is it often neglected?
Because it simply analyzes the closing price of an asset over previous 26 periods, Chikou Span does not really predict future price behavior of an asset.
It makes it difficult for traders to make decisions since it does not provide a clear picture of the position without the help of other Ichimoku indicators.
It occasionally sends out erroneous signals.
What's the best time frame to use Ichimoku? And what is the best indicator to use with it? (screenshots required)
ANSWER
The trader can choose the time frame they wish to use the Ichimoku Indicator. Varied people have their own trading patterns and schedules, all of which have a different time frames. But I believe that any time frame can be used with the Ichimoku Indicator. However, depending on the trader, the indications you receive on a given chart across various time periods are clearly different. If you use Ichimoku on a one-hour chart, you will possibly get a different message than if you use it on 2 days chart.
As a result, a trader who is used to trading on a short time frame can employ Ichimoku on a shorter time period spanning from one minute to four or six hours, and a trader who is used to a longer time frame can employ Ichimoku on anything from a daily chart to a week.
The best indicator to use with it?
Combining another indicator in addition to Ichimoku can help to filter out erroneous signals and prevent bad decisions. For example, the market may be going in a uptrend move, but you believe the trend is reversing or heading downhill because of your interpretation. It's possible, however, that you're seeing a short-term value fluctuation inside a larger trend. Using another matching indicator to confirm what is happening and maybe it is a significant signal or not is a good idea.
Ichimoku was created to be a reliable and effective indicator, but it also performs more brilliantly when used in collaboration with Relative Strength Index (RSI) indicators.
Ichimoku collaboration with RSI
Conclusion
Don't be alarmed if the Ichimoku indicator looks to be too much or beyond one's capabilities at first glance. It's supposed to be jam-packed with useful information that traders can apply to whatever positions they take, but a chart suddenly flooded with red and green clouds might catch a beginner trader off guard.
True, Ichimoku appears to be technical, but once you understand its patterns, it may be really useful, combining multiple indications to provide a quick overview of the market.
To take advantage of the Ichimoku's unique qualities and signals, take the time to grasp what each component piece of the Ichimoku performs.
Thanks to Prof @kouba01 for the wonderful lecture
Hello @benie111,
Thank you for participating in the 1st Week Crypto Course in its third season and for your efforts to complete the suggested tasks, you deserve a 5/10 rating, according to the following scale:
My review :
An article with a medium content that contained answers to various questions that lacked depth in the analysis, and I will justify some of the observations for you:
You should support this approach with clear examples or arguments.
Your interpretation of the use of the two lines Tenkan-Sen and Kijun-Sen, alone or together, was succinct, and also the signals extracted from them did not appear on the illustrations.
Thanks again for your effort, and we look forward to reading your next work.
Sincerely,@kouba01
Professor @kouba01, thanks for the review. But you didn't put overall rating.
Kindly take a look
That s done!