STEEMIT CRYPTO ACADEMY ||SEASON 3 WEEK 2|| INTRODUCTION TO CHARTS|| HOMEWORK POST FOR PROFESSOR @reminiscence01.
EXPLAIN THE JAPANESE CANDLESTICK CHART. (CHART SCREENSHOT REQUIRED.)
Charts are the visual representation of an activity over a specified period of time by the use of lines, symbols, graphs, pictures etc. charts can be used to represent any kind of information, but in this submission I will be dealing with the use of charts in the crypto trading. These lines, graphs are drawn in a systematic manner that it is able to reflect the actual information.
In crypto trading, Charts are used represent or express the movement in the price or value of cryptocurrencies. Crypto investors who use technical analysis for trading make good use of these charts in their analysis. Charts are the foundation for technical analysis.
There are different models or types of charts in crypto trading. They are all developed from different ideas about how it should be represented, but they all have the purpose of depicting the price movement of crypto currencies during a specific time period.
Some of the types of charts used are: Line Charts, Bar charts, Candlesticks chart, Tick Charts etc. for thr purpose of this assignment I will be explaining the Japanese Candlestick Chart which happens to be the most used Chart in crypto trading.
JAPANESE CANDLESTICK
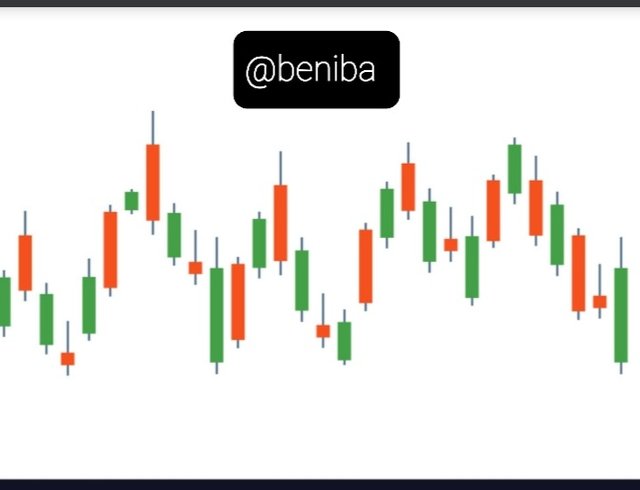
It is believed that this chart was developed in the 18th century by a rice trader in japan by name :Muneshia Homma. Japanese candlestick chart is a graphical representation of the INTERACTION between buyer and sellers in a trading avenue. Candlestick can be used in all aspects of trading but I’m limiting my write up to only crypto trading. In this chart a candlestick is used to illustrate the price movement of a currency over a specified period of time.
The candlestick Is comprised with four major aspects each representing a specific point in the price movement. These parts are called open, close, high and low.
Let me now explain what these points mean on the candlestick.
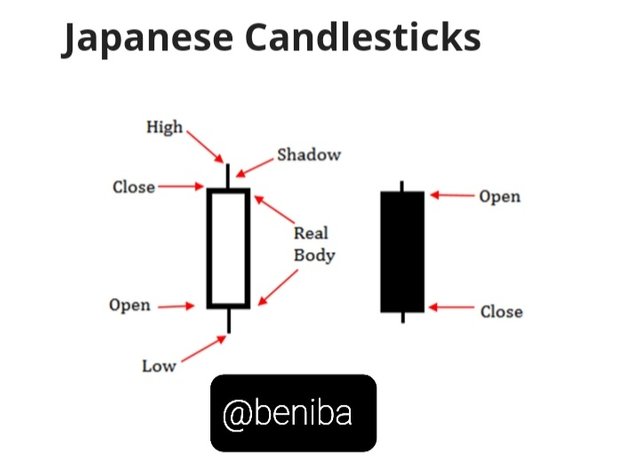
• OPEN
This is known as the opening price, this part marks the beginning of the price movement. This is the price the price movement started with, it is the foundation price of the price movement for the specified time.
• HIGH
This is known as the highest price. As the name suggest this part of the candle indicated the highest price of the asset during the time of study.
• LOW
This is also known as the lowest price, it marks the lowest price recorded in the price movement in a specified time.
• CLOSE
This is the closing price. This part of the that tells the ending price within a specified time. It marks the end of candle.
The candle also has a part called a shadow and this also shown the struggle that existed between buyer and sellers in a specified time. It shown an instability of price. The height of a candle shows the change of price during a specified time. It is the difference between the opening and closing price.
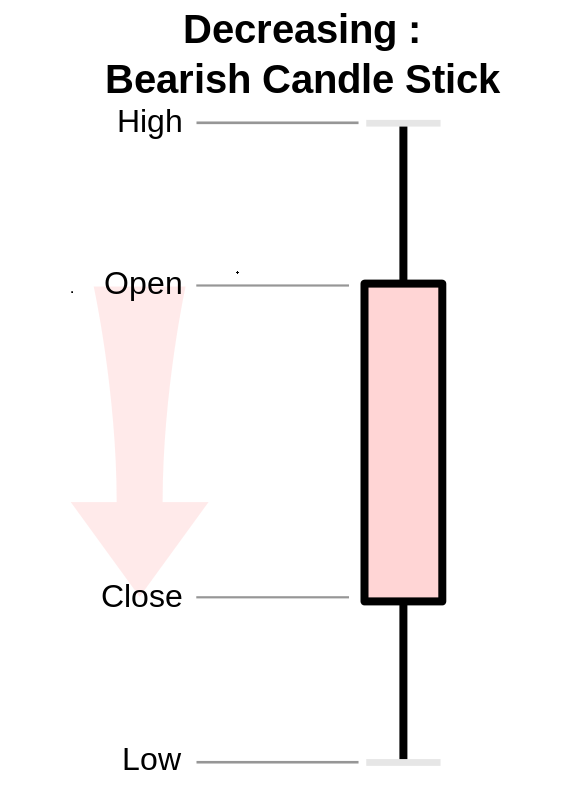
In cases where the opening price is higher than the closing price, the candlestick is called BEARISH CANDLE STICK
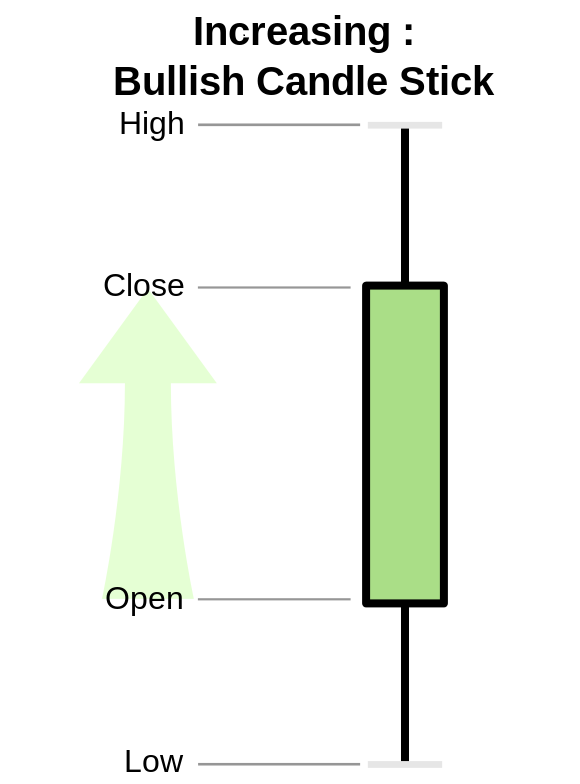
When the closing price is higher than the opening price, the candle stick is called a BULLISH CANDLESTICK.

DESCRIBE ANY OTHER TWO TYPE OF CHARTS (SCREENSHOT REQUIRED)
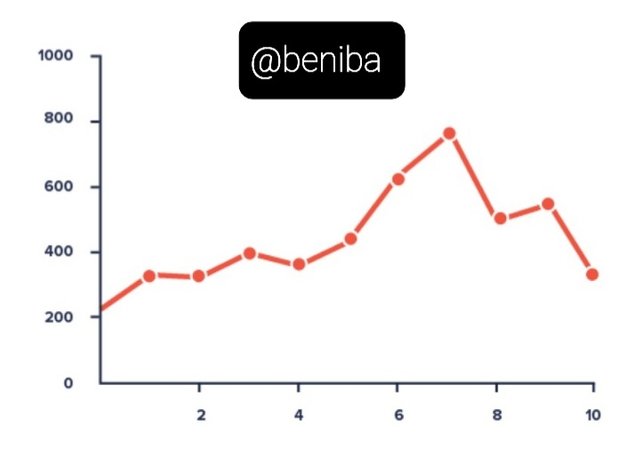
• A line chart is always plotted on two axis, the X and Y axis with price on one and time on the other.
• A simple line is used to illustrate the price movement
• The line chart clearly shows the market trend.
Source
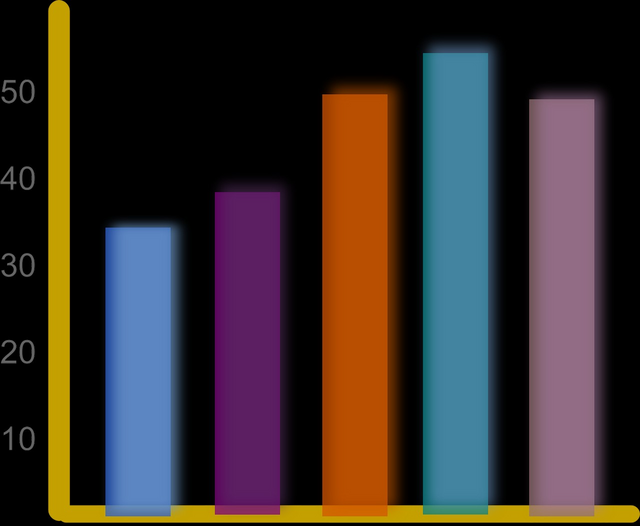
• It involves the use of two axis, the X and Y axis to plot for time and price
• It involves the use of rectangular boxes to represent price movement.
• Interpretation is easy.
source
IN YOUR OWN WORDS EXPLAIN WHY THE JAPANESE CANDLESTICK CHART IS MOSTLY USED BY TRADERS
Japanese candlestick chart Is widely used by traders across the world because of its great qualities.
The candle sticks are well designed that they contain every information a trader will need in order to make the right decision. It includes the opening, closing, highest and lowest prices.
A collection of the candlesticks gives a clear market trend of the asset so it makes it easier to make a correct prediction of the future price movement of the asset. It makes it possible for a trader to know which phase the market is in and the move to make at that time.
DESCRIBE A BULLISH CANDLE AND A BEARISH CANDLE IDENTIFYING ITS ANATOMY (SCREENSHOT IS REQUIRED)
A bullish candle is a representation of price movement where there is an increase in the value or price of an asset. This means that the closing price of the candle stick is always higher than that of the opening price. I would like to clear the notion that the bullish candle is always represented with a green color which is not true because depending on the individual the color can be changed to any preferred color. When bullish candles occur sequentially in a chart an uptrend is created.
source
A bearish candle is a representation of a price movement that exhibits a decline in the price of an asset within a specific time. This also implies that the opening price is always higher than the closing price which means there is the decrease in the price or value of the asset. When bearish candles occur sequentially a down trend is created.
source
This lecture has really been very educative. I have learnt about the importance of charts in trading and I have now realized that you need to understand and apply these charts in your decision making in order for you to be very successful in trading.
I will end by saying a very big thank you to Professor @reminiscence01 for a wonderful lecture and looking forward to getting the next lecture.
Thank you for reading.
Hello @beniba , I’m glad you participated in the 2nd week of the Beginner’s class at the Steemit Crypto Academy. Your grades in this task are as follows:
Observations:
That's true. This is the reason candlestick chart is widely used by traders. It shows the information and interaction between buyers and sellers and this is reflected in the shape of the candle.
Recommendation / Feedback:
Thank you for submitting your homework task.
Thanks for your review