Crypto Academy / S5W5 - Homework Post for @sachin08".

Explain Wedge Pattern in your own word.
A wedge pattern is a type of price pattern that is derived from the drawing of two trendlines that converge at a point giving it a wedge shape. The two trendlines are gotten by drawing a line to connect various highs or lows of the price movements over a period. The two trendlines are the upper trend line which connects the highs of the market over a period and is deemed to be the resistance. The other trendline is the lower trendline is also connects the various lows of the period and it is also known to be the support.. The wedge pattern formed can be in either an upward direction or a downward direction. This price pattern can be very useful in technical analysis. It can be used to detect a possible trend reversal.

Explain both types of Wedges and How to identify them in detail. (Screenshots required)
The two types of Wedges we have are;
- Falling wedge
- Rising wedge.
To explain this to a learned person in crypto world I will just say a falling wedge is formed during the end of a bearish trend. Thus, when the price of an asset has been constantly falling for a some periods the wedge formed will be seen to be converging at a point lower than where the two trendlines originates from. A falling wedge mostly gives a buy signal because the price break from the resistance at appoint where the price is low.

HOW TO IDENTIFY A FALLING WEDGE
In order to identify that a pattern formed is actually a falling wedge the following conditions must be met.
- The candlesticks forming the shape must at least touch the trendlines 5 times in total in order to be valid.
- The two trendlines forming the wedge must be slopping in nature. Thus you identify a falling wedge by the direction in which it takes. The two trendlines converges at a point that gives it a sloping nature.
- The volume of the asset appears to also decreasing during this period.
To explain this to a learned person in crypto world I will just say a falling wedge is formed during the end of a bullish trend. This means that , when the price of an asset has been constantly increasing or on the rise for some periods the wedge formed will be seen to be converging at a point higher than where the two trendlines originated from. A rise wedge mostly gives a sell signal because the price break from the support at a point where the price is higher.

HOW TO IDENTIFY A RISING WEDGE.
In order to identify that a pattern formed is actually a rising wedge the following conditions must be met.
- The candlesticks forming the shape must at least touch the trendlines 5 times in total in order to be valid. These touches can be is supposed to be from the two trendlines.
- The two trendlines forming the wedge must be seen moving in an upward direction and in nature and converge at a point upper than where they started from.

Do the breakout of these Wedge Patterns produce False Signals sometimes? If yes, then Explain how to filter out these False signals.
I will answer this question by first stating that no trading strategy or technical analysis tool is 100%. This is to suggest that at any given time a strategy any give false signals. This means that yes breakout of wedge patterns sometimes gives false signals.
In trying to filter out these false signals you will have to adapt other technical analysis tools or strategies to confirm if the signal given Is valid or false. You can combine this trading strategy a different technical analysis tool.
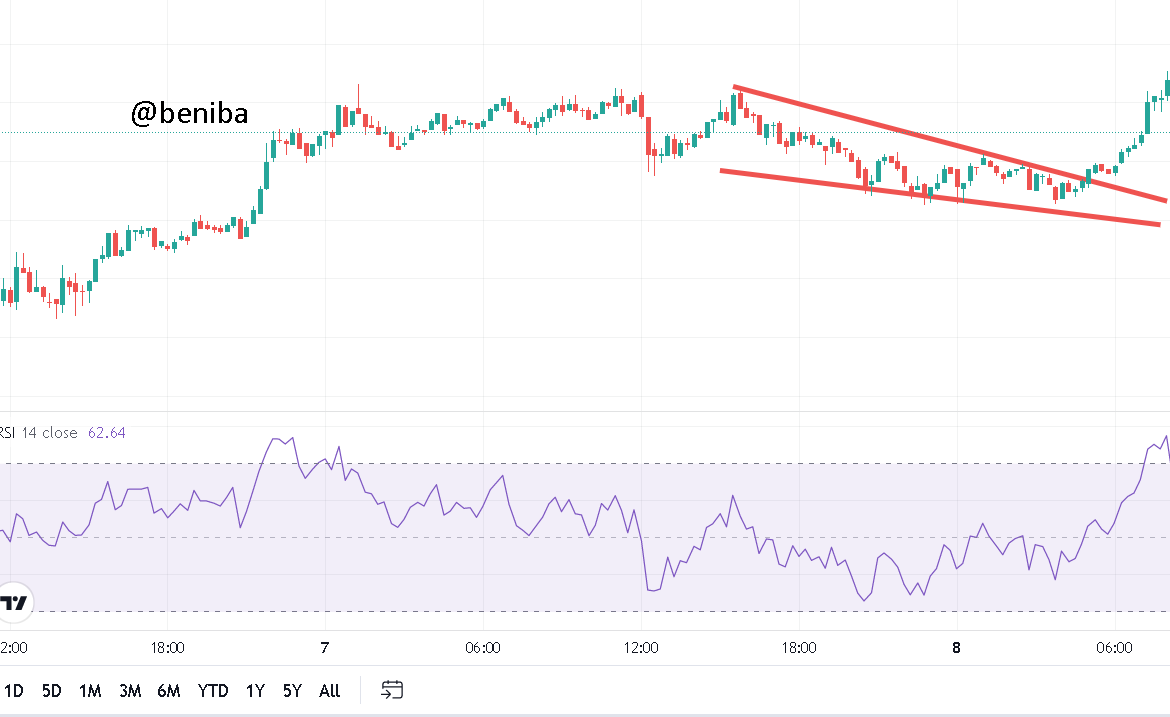
For the purposes of this assignment I will be using the relative strength index (RSI) to confirm the signal given by a wedge pattern.
Show full trade setup using this pattern for both types of Wedges.( Entry Point, Take Profit, Stop Loss, Breakout)
FALLING WEDGE
This wedge pattern is very useful In creating good entry points because the price breaks out a point where the price of asset is relatively lower.
The point marked A will be the breakout point.
The point marked B will be my entry point and the other relevant points are indicated on the chart.

RISING WEDGE
The point marked A will be the breakout point.
The point marked B will be my entry point and the other relevant points are indicated on the chart.

Trading with the wedge pattern strategy can be very fruitful yet very confusing. you will need to have a very fair understanding about how it works. you will need to combine with other indicators in order to get very good outcome. thanks to professor @sachin08 for this lecture.