Crypto Academy Season 2 Week 6 Homework Post for @fendit - Elliott Wave Theory
After the class by @fendit on Elliott wave theory, I will be taking part in the assignment and without further ado, I should begin.


A) Share your understanding of this lecture by answering the following questions:
What's the application of this theory?
There are several approaches to speculating the market, it can either be fundamental or technical analysis. While fundamental deals with socioeconomic information, consuming units, news, and so on, while technical analysis deals with studying past market movements to propose future actions.
Discovered by R.N Elliott, the Elliott wave theory looks at the market trend as a circle of eight waves movement which is divided into 5 up move waves, and 3 down move waves. This 5 waves structure is known as the Impulse wave (excluding the correction trend) and the 3 waves structure known as the corrective wave.
Elliott wave theory can be used to predict the profitability of a trend and the next move of the trend. According to Elliot's wave theory, every market follows a pattern, so traders can be able to identify these patterns and use them to predict future movement.
The Elliott wave consists of eight waves, five impulse waves with three upward moves and two correction move after which the corrective waves of three main waves (in a bull market), and the wave moves in the opposite direction (in a bear market) follow.
What are impulse and corrective waves? How can you easily spot the different waves?
Impulse Waves
A wave is a market movement from a low point to a high point and from a high point to a low point. The market would always go up or down thereby creating a bullish or bearish pattern at any point in time. The type of market trend or pattern available determines what the impulse would be. Impulsive waves are waves that follow the market trend move. If a market is bullish, the impulse trend and waves would be bullish and vice-versa.
The impulse waves are characterized by five trends/waves which are numbered 1 to 5. to understand and be able to identify them, the odd numbers (1,3,5) follow the market direction while the even numbers (2,4) are against the market serving as a correction. With the impulse waves, the trend can go beyond 5 waves and when it does, it is referred to as extensions.
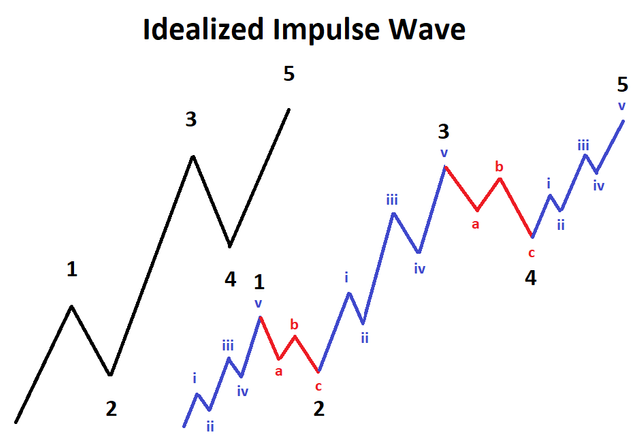
Wave 1 - The first wave which often identified with a high in the direction of the market. This way is referred to as a driving move in the direction of the market. The movement from the point of origin to point 1 has 5 sub-waves. This is the period characterized by early investors.
Wave 2 - The second wave movement is a correction wave as a result of people selling their holding to cash out their profit. The second wave does its retrace but never exceeds 100% of wave 1. If there is a correction in price that goes 100% beyond the origin of wave 1, then it should be certain that the Elliott wave is wrong. Wave 2 should sub-divide into 3 sub-waves.
Wave 3 - This is another impulse wave in the direction of the market. The is often the largest, longest, and most powerful wave in the Elliott wave. It should subdivide into 5 sub-waves. It is believed that at point three, traders are getting into the market.
Wave 4 - This is another retracing wave with 3 sub-waves. The wave shouldn't go below 100% of wave 3 to touch wave 2. It is also regarded as a sell-off to cash out a profit.
Wave 5 - This wave is sub-divided into 5 sub-waves. At the 5th wave, volume is reduced, width and price is weakened. The 5th wave takes an ending diagonal form. The 5th wave gives room for a corrective wave.
The waves could go beyond 5 waves up to 9 waves and this is referred to as extensions
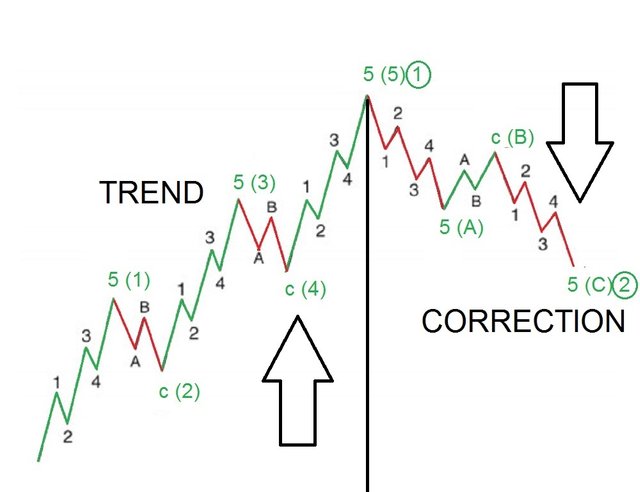
Corrective Waves
Corrective waves are a move in the opposite direction of the trend but the corrective wave never goes below the origin of the impulse waves. When a corrective wave hasn't met its price target and needs to extend in time, then it is referred to as Combination waves. Corrective waves usually take the form of ABC but then the corrective wave are of different types namely; Zigzag correction, Flat correction, and Irregular Correction.
What are your thought on this theory? Why?
The Elliott Theory can be very confusing to traders and it can be used successfully in a trade but then it deals with traders and investors' psychology and sentiments which are hope, greed, and despair. It deals with crowd behavior instead o proper calculation.
For instance, if there are five traders in a room and five of them are on a buying spree on an asset only to count the 5 impulse wave of Elliott, the human sentiment of despair will kick in and 4 of 5 traders will pull out funds and short the market with the aim that the next wave will be a corrective wave. There does not need to be a news or external effect, it is just a setting of the mind that the Elliott wave comes with impulse and corrective waves thereby making the market easily manipulated.
Since the cycle is fractal and never ending, it has been a very good technical analysis for entry and exit of a trade by traders. It also shows the strength of the market at a given period of time.
Choose a coin chart in which you were able to spot all impulse and correct waves and explain in detail what you see. Screenshots are required, and make sure you name the cryptocurrency you're analyzing.
To answer this, I will be using the BTC/USDT trading pair on Binance with Tradingview. Tradingview is a chart platform where traders utilize tools from the platform to analyze the market. In the cryptocurrency world, BTC has more dominance and it was the first coin to be listed on an exchange, so it should have a long historical chart that can be useful in reading and analyzing. With this, it is very easy to check for Elliott wave. Do not forget that the Elliot wave is a continuous wave so it can be drawn anywhere on the chart provided it is visible.
- First is to view the trading page for BTC/USDT
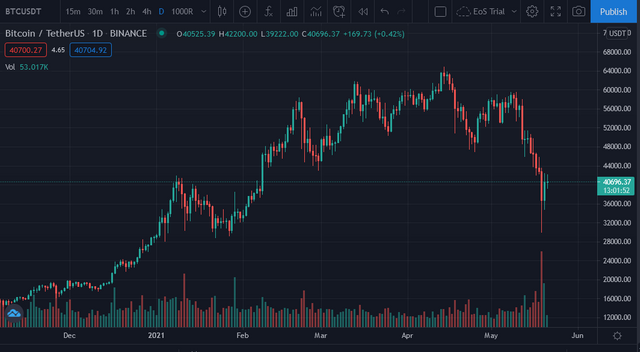
- Next is to select the timeframe to view (for me, I will be using the 1-day time frame)
- Next is sellect the Elliott wave tool, the first tool to pick is the Elliott impulse wave (12345)
- After picking the took, the first five impulse wave is drawn but first a base is needed. My base is the ground candlestick before a movement and for the chart, my base is $19348.08 and my wave 1 is $41410.98. Wave 2 is going to be a correction/reversal wave but it should not go 100% to the ground point. Wave 2 ended at $29111.55 and it follows another impulse wave (wave 3). Wave 3 is the longest wave and in this case, it reaches $61952.29 and then a correction/reversal wave 4 follows at $50542.44. The 5 wave is the last impulse wave which ends at $64741.85.
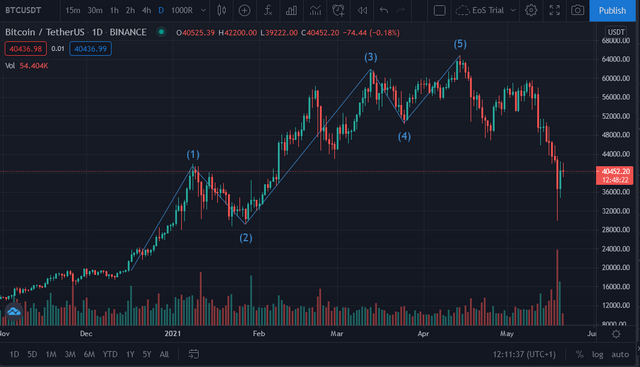
- To draw the corrective wave, you pick the Elliott correction wave (ABC)
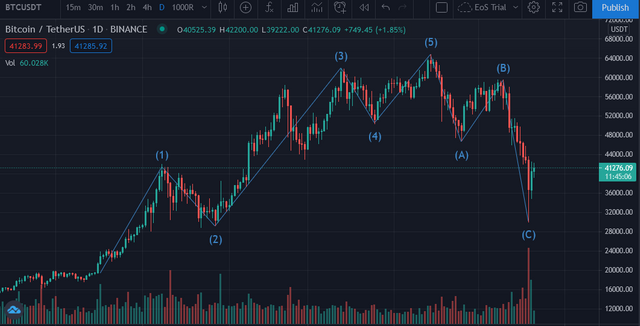
The base for the correction wave starts with with 5 and the first correction wave is A and then an impulse to wave B and a reversal to wave C.
Conclusion
Elliott wave is not recommended alone to determine the movement of price as its impulse wave can exceed 5 waves. It is advisable to use other indicators while trading with Elliott wave. MACD and RSI are very good indicators to use with Elliott wave while trading.
Thank you for being part of my lecture and completing the task!
My comments:
The pattern wasn't that correct, there was a misunderstanding when identifying the wave 3...
Explanations were fine, but I wish you had analyzed a bit more the graph that was asked!
Overall score:
6/10