Steem Crypto Academy Season 4 Week 2 || Technical Indicators by @beewrites

Designed using Canvas
Hello steem academy family. Thank you Professor @reminiscence01 for this interesting topic. Here is my entry on the given assignment.
1a. In your own words, explain technical indicators and why it is a good technical analysis tool?
Technical Indicators are technical analysis tool that graphically explains the past and present movement of prices in the Crypto market so as to help the traders have a foresight or judgment of what the future price will be. It uses the previous prices as a judgement of the future price. The technical indicator shows the trends, the average price and also the volatility (increase or decrease) in the market.
The technical indicators uses the psychology of the market that through careful and constant study of the prices in the past, can give a fair judgement of the future price.
Some technical indicators can be used alone; that is used as a standalone, while some are often paired with other indicators, although this has been proven to be unhealthy for a trader to use one indicator alone
The technical indicator has proven to be a very helpful trading tools for so many reasons. One of which is that it gives the trader a prediction or foresight of the future price of a security through careful study of the past ones
The technical indicator serves as an alarm to alert the trader when prices are declining or increasing so he will trade wisely to make profit. It tells the trader the perfect time to but and sell so you'll not be taken by surprise
It is useful in checking the accuracy or weakness of other technical indicators
1b. Are technical indicators good for cryptocurrency analysis? Explain your answer.
Yes, technical indicators are really good for cryptocurrency analysis.
•Using technical indicators, a trader will find out the strength and weakness of a cryptocurrency by following the historical prices, movement and careful study of trend and chart of that cryptocurrency
•Since the Crypto market goes high and low all day, this is to say cryptocurrency is Volatile in nature and it is of good need for technical indicators to tell the trader when to enter or exit a trade so he will not make loses.
•Technical Indicators shows the trader the rate of demand and supply of security in the market
•Technical Indicators are good technical analysis tool because it gives a picture of what the future price of a cryptocurrency looks like by the accumulation of records of the past prices
1c. Illustrate how to add indicators on the chart and also how to configure them(screeshots needed)
ALL SCREENSHOT DONE WITH MY PHONE
I will be using the trading view website Link
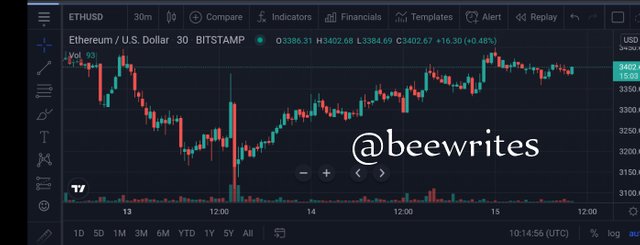
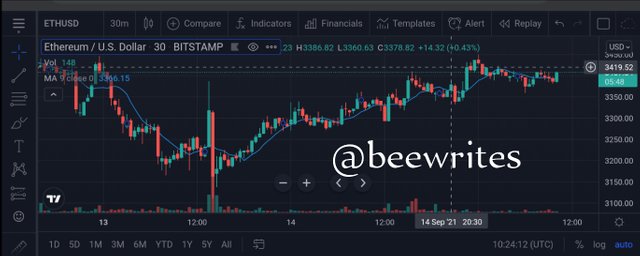
•Go on the trading view website, click on chart
•Select coin you want to use. I'm using Ethereum US Dollar (ETHUSD) on a 30 minutes frame for this assignment.
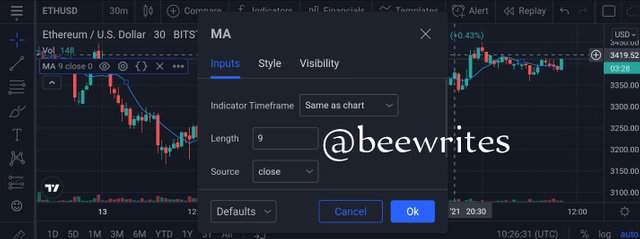
•Click on FX indicators and pick any indicator of your choice.
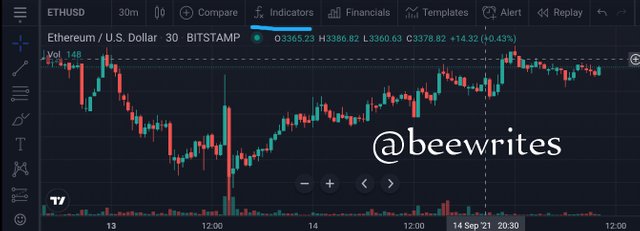
You can make them your favourite by clicking the star botton
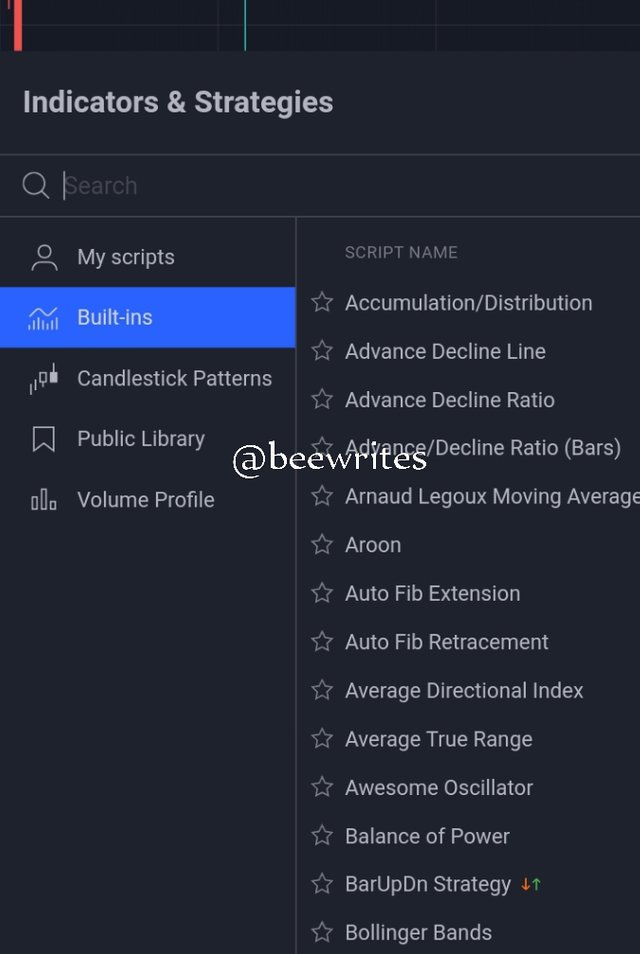
•I will be using the moving average indicator
To configure or Change the format of my indicator, I'll click on the indicator I used(moving average indicator) and go to settings to make the changes.
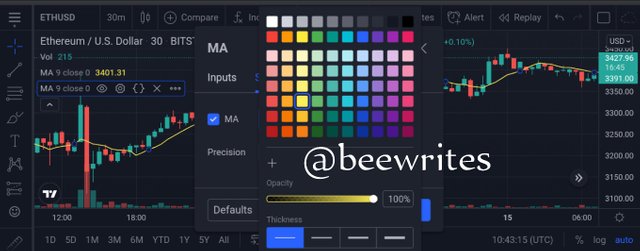
You can change the input, style and visibility
I want to change my color to yellow
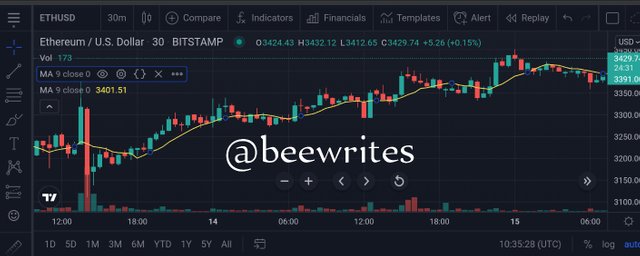
Finally configured
2a. Explain the different categories of Technical Indicators and give an example of each category, also show an indicator used as an example in your chart ( screenshot needed)
Technical Indicators are of 3 major types
•Trend following indicators
•Momentum Based indicators
•Volatality Based indicators
•Trend Following Indicators
This indicator helps the trader in the stock market know the direction a trend is following, it tells the trader if the trend is going upward or if it is trending downward. The trend following indicator is easy to use because the graph is simple to understand. It is not advisable to trade when the trend is down, because a downward trend gives the trader loses.
Examples of trend following indicators
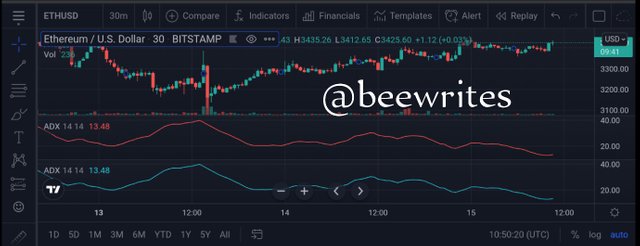
Moving Average, Inchimoku Kinko Hyo, Average Directional Index
This is a graphical example of a trend following indicators: Average Directional Index. It shows the direction the trend is going
• Momentum Based Indicators
It is otherwise called oscillator. It shows the velocity rate at which prices oscillate per time using the historical price value. This indicator gives the trader information on the strength (highness) and weakness (lowness) of a price. Momentum Based Indicators measures the rate at which prices increases and decreases per time, this will give the trader information about the best time to trade .
Examples of oscillators, Stochastic, Relative Strength Index (RSI), Moving Average Convergence Divergence (MACD)
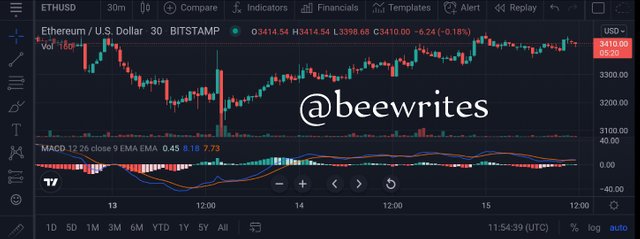
This is an example of momentum based indicators. This is a Moving Average Convergence Divergence indicator
• Volatility Based indicator
Cryptocurrencies are usually not steady, it tend to change per time due to some reasons for instance slippage, the unstableness is called volatility. So, Volatility Based indicator are technical analysis tool that manages the unstableness of the prices of a cryptocurrency.
The indicator pays attention to the volatility of the Cryptocurrency and tells the trader what will happen next, if the price will increase or reduce .
Examples are Bollinger Band (BB), Keltner Channel, Average True Range ( ATR)
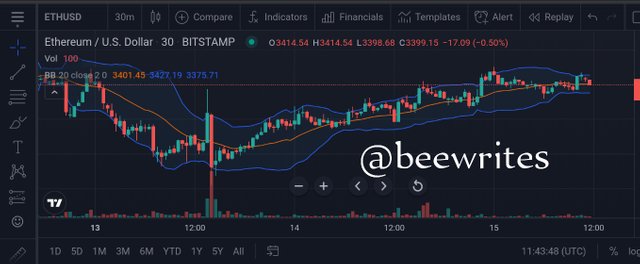
This is Bollinger Band Indicator an example of volatility Based Indicators
2b. Briefly explain the reasons why indicators are not advisable to be used as a standalone tool for technical analysis
Indicators are best advised not to be used alone because they are not always accurate in their readings and prediction. There prices are sometimes misleading and not current. This will make the trader make loses in his trading.
Also, using one indicator cannot confirm itself, you'll need more than one indicator to confirm if the readings of the other indicator is up to date and accurate So it is advised to use more than one indicator for clarity, accuracy and confirmation sake
2c. Explain how an investor can increase the success rate of a technical indicator signal
An investor can increase the success rate of a technical indicator signal by having a concrete and comprehensive knowledge of the functions of the indicators. You cannot properly get the goodness of a thing without having a grounded knowledge of that thing.
Another means an investor can increase the success rate of a technical indicator signal is by merging two or more indicators together this will limit the amount of errors gotten and also increase profit rate
Example
Merging the Bollinger Band and Average True Range together will yield a good increase because the Bollinger Band will be predicting the movement of the prices in the market, while ATR will be give you a clue of the duration of the movement before it gets to the market
Conclusion
Hello @beewrites , I’m glad you participated in the 2nd week Season 4 of the Beginner’s class at the Steemit Crypto Academy. Your grades in this task are as follows:
Recommendation / Feedback:
I like the way you explained technical indicators in detail. I encourage you to learn markdown styles and also use page dividers to separate different sections of your work.
Thank you for completing your homework task.
Good afternoon Professor @reminiscence01.
I'm bringing to your notice that my account hasn't been upvoted by @steemcurator02.
Today is the 7th day and It's 4 hours into the 8th day.
Thank you as you treat with urgency
I can see your post has paid out without getting curated by @steemcurator01. Please kindly repost with a screenshot of my review.
Thank you.