[Trading Crypto with On-Balance Volume Indicator] - Crypto Academy / S5W4 - Homework Post for @fredquantum.
Hello everyone, a warm welcome to week 4 of this season's lesson series. The lesson taught by professor @fredquantum discussed Trading Crypto with On-Balance Volume Indicator. In this post, I will be responding to the assignment given.

Question 1
In your own words, explain your understanding of On-Balance Volume (OBV) Indicator.
On- Balance Volume (OBV) Indicator
The On-Balance Volume indicator is a volume-based indicator that is comprised of an oscillating line that indicates the momentum of buying and selling pressure of an asset through its volume flow (volume-up and volume-down) in the traded market. The OBV Indicator concept was introduced by Joseph Granville in the year 1963 via a publication released on stock markets.
The OBV indicator works by representing the cumulative volume flow (volume-up and volume-down) in a single line, which oscillates within the volume bound of the asset. Ideally, the OBV indicator indicates the presence of volume in either direction of the market, and in some cases can be used to confirm the trend.
For instance, In an up-trending market, if the volume flow is high (which indicates inflow of capital), the OBV indicator will indicate an increasing inflow of cash with an increasing curve. This in turn supports the continuous increase in the price of the asset, hence providing traders with multiple buying opportunities.
Similarly, In a downtrending market, if the volume flow m is high (which indicates an outflow of capital)**, the OBV indicator will indicate an increasing outflow of cash with a decreasing curve. This in turn supports the continuous decrease in the price of the asset, which provides traders with multiple selling opportunities.
Following the above principles, the OBV indicator can confirm the directional movement of price with the formation of higher highs for an uptrend, and lower lows for a downtrend. This correlates with the principles of demand and supply, where buying pressure creates demand, which forces the price of the asset to increase, and selling pressure creates excess supply, which forces the price of the asset to decline.

Question 2
Using any charting platform of choice, add On-Balance Volume on the crypto chart. (Screenshots required).
Adding OBV Indicator to Charts
To add the OBV indicator to the price chart, visit any price chart platform that supports the use of indicators. For this illustration, I chose Tradingview.
First, visit Tradingview's official website and access the chart section of the platform.
Next, click on indicators or Fx at the top center menu.
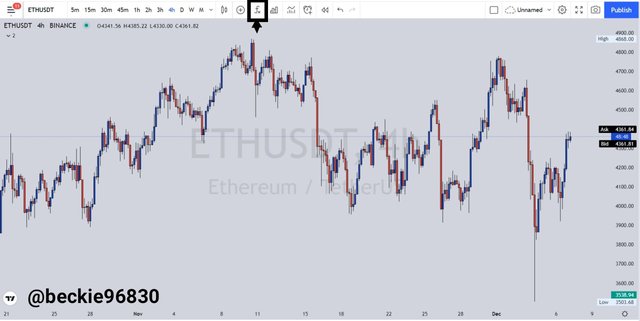
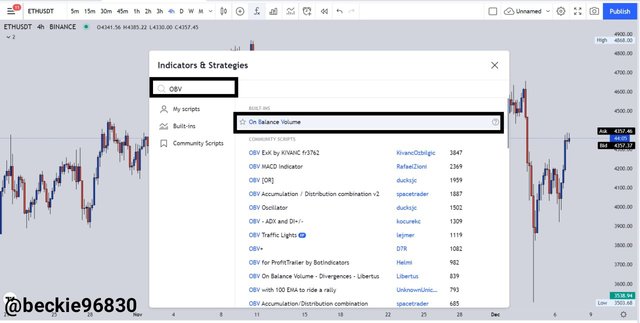
Next, search for the OBV indicator using any relevant keyword like OBV, etc.
Then click on the indicator search result to add the OBV indicator to the price chart.
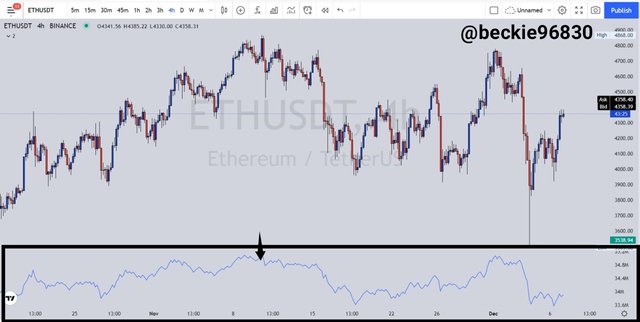
The OBV indicator has been added to the price chart, indicating the volume flow of the asset.

Question 3
What are the Formulas and Rules for calculating On-Balance Indicator? Give an illustrative example.
OBV formulas and Rules
The OBV indicator has a mathematical expression and rules that represent the concept of volume flow relative to the price movement of an asset, and the formula is as follows:
OBV = OBVprev (+/-/= Current Volume)
Where:
OBVprev = Previous On-Balance Volume level.
With the above formula, there are rules to be followed in other to obtain the current OBV level of a traded market. The rules are as follows:
Rule 1
If the current closing price is higher than the previous closing price, the OBV value is determined by:
OBV = OBVprev + current Volume
Rule 2
If the current closing price is lower than the previous closing price, the current OBV value is determined by:
OBV = OBVprev - current Volume
Rule 3
If the current closing price is equal to the previous closing price, the current OBV value is considered equal, which is expressed mathematically as:
OBV = OBVprev + 0
To illustrate how the OBV indicator value is calculated, consider the example below:
An ETHUSDT chart has the following price readings:
Current closing price = $4,230
Previous closing price = $4,160
Current Volume = $13.04M
From the above data, the OBV indicator value will be calculated thus:
OBV = $4,160 + $13.04 M
OBV = $13.044 M
With the above OBV value, the OBV indicator curve increased to the upside as the current closing price is higher than the previous closing price. This implies that there are more buyers in the market than sellers, and the current price movement is bullish.

Question 4
What is Trend Confirmation using On-Balance Volume Indicator? Show it on the crypto charts in both bullish and bearish directions. (Screenshots required).
Trend Confirmation Using OBV indicator
The OBV indicator represents the volume flow (inflow and outflow) of a traded market. This implies that there is a correlation between the movement of price and the Movement of the OBV indicator. Ideally, the inflow of capital into an asset market represents an increasing value of the asset which forces the price of the asset to increase, hence the formation of an uptrend. Likewise, an outflow of capital from an asset market represents a decreasing value of the asset, which for the price of the asset to decline, hence the formation of a downtrend.
OBV indicator in Uptrend
The OBV indicator confirms an uptrend with the movement of the OBV curve to the upside while forming a sequence of consistent higher highs and high lows. This of course correlates with the bullish movement of price. To illustrate this, consider the chart below:
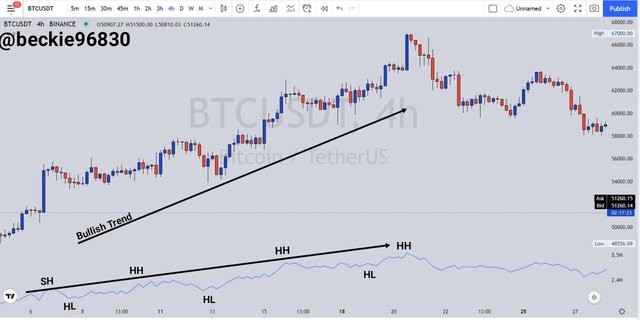
From the above BTCUSDT chart, it is observed that the current trend was bullish, and the OBV indicator curve confirmed the trend with the formation of consistent higher highs (HH) and higher lows (HL). The OBV indicator volume flow curve was moving to the upside, which indicated the inflow of capital as buyers are in control of price.
OBV indicator in Downtrend
The OBV indicator confirms a downtrend with the movement of the OBV curve to the downside while forming a sequence of consistent lower highs and lower lows. This of course correlates with the bearish movement of price. To illustrate this, consider the chart below:
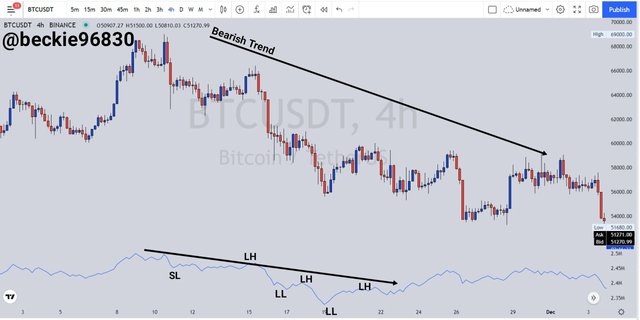
From the above BTCUSDT chart, it is observed that the current trend was bearish, and the OBV indicator curve confirmed the trend with the formation of consistent lower highs (LH) and lower lows (LL). The OBV indicator volume flow curve was moving to the downside, which indicated the outflow of capital as sellers are in control of price.

Question 5
What's your understanding of Breakout Confirmation with On-Balance Volume Indicator? Show it on crypto charts, both bullish and bearish breakouts (Screenshots required).
Breakouts and OBV Indicator
Breakouts in trading occur after a period of sideways movement of price, where price fluctuates within a determined level of resistance and support. The OBV indicator can be used to confirm the breakout as volume is required to break either the resistance level or support level before the price can continue in a specified direction. Technically, the OBV indicator line moves in the same direction as the breakout to confirm the volume flow (inflow or outflow) that supports the breakout of price.
OBV Breakouts in Uptrends
In an uptrend, a breakout can occur at a resistance level, which signals a continuation of the bullish trend. The OBV indicator confirms the breakout with the volume flow curve breaking above the range of its sideways movement. This break confirms the inflow volume that supports the bullish movement of price. To illustrate this, consider the chart below:
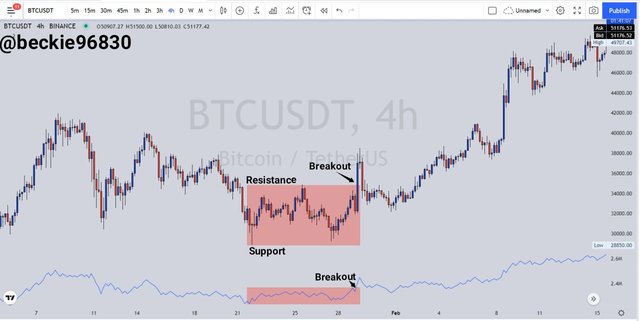
From the BTCUSDT chart above, the OBV indicator confirmed the breakout with the increase in volume flow to the upside. This indicates the presence of buyers being in control of price, which also supports the bullish movement of price as more demand is being created.
OBV Breakouts in Downtrends
In a downtrend, a breakout can occur at a support level, which signals a continuation of the bearish trend. The OBV indicator confirms the breakout with the volume flow curve breaking below the range of its sideways movement. This break confirms the outflow volume that supports the bearish movement of price. To illustrate this, consider the chart below:
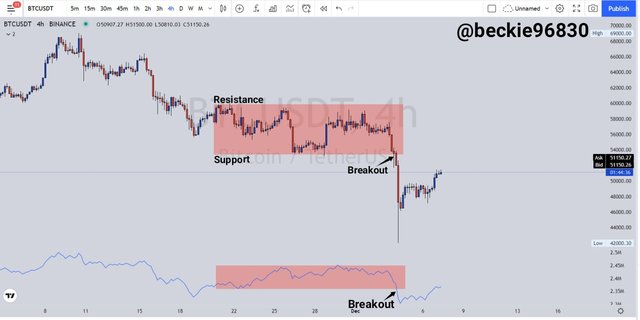
From the BTCUSDT chart above, the OBV indicator confirmed the breakout with the increase in volume flow to the downside. This indicates the presence of sellers being in control of price, which also supports the bearish movement of price as more supply is being created.

Question 6
Explain Advanced Breakout with On-Balance Volume Indicator. Show it on crypto charts for both bullish and bearish. (Screenshots required).
Advanced Breakout Using OBV Indicator
The concept of advanced breakouts using OBV is a technique that required the OBV volume flow curve to breakout from a range movement before price movement follows. The common principle that governs this technique is that price will eventually follow the volume flow curve. This breakout technique helps traders enter at even more discounted prices before the breakout occurs.
In an uptrend, the advanced breakout will first occur with the OBV volume flow curve, where the curve breaks above the range resistance before price movement breaks above the range movement. To illustrate this, consider the chart below:
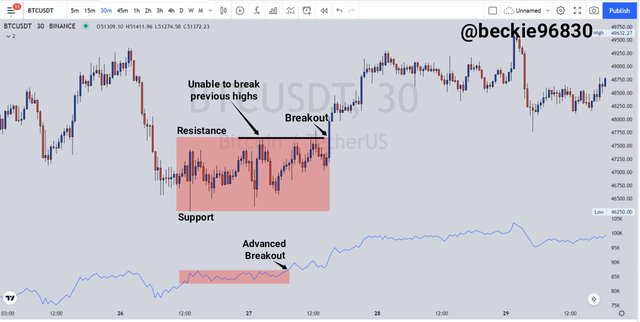
From the BTCUSDT chart above, price movement failed to break out of the range, as the resistance was respected multiple times. But the OBV indicator curve broke out of its range, by breaking the resistance. This implies that there is enough volume for the price to breakout out of the range. As been, the range resistance was broken and the price continued in an upward direction.
Similarly, In a downtrend, the advanced breakout will first occur with the OBV volume flow curve, where the curve breaks below the range support before price movement breaks below the range movement. To illustrate this, consider the chart below:
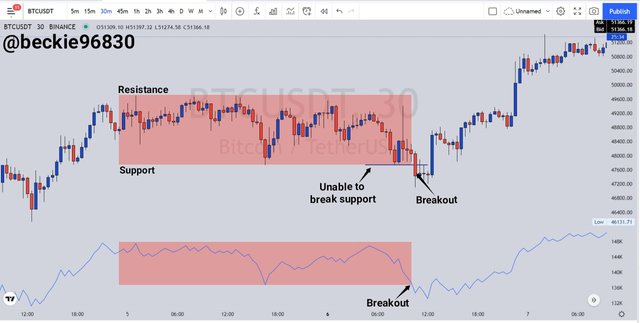
From the BTCUSDT chart above, price movement failed to break out of the range, as the support was respected multiple times. But the OBV indicator curve broke out of its range, by breaking the support. This implies that there is enough volume for the price to breakout out of the range. As been, the range support was broken and price continued in a downward direction.

Question 7
Explain Bullish Divergence and Bearish Divergence with On-Balance Volume Indicator. Show both on charts. (Screenshots required).
OBV Indicator and Trend Divergence
Divergence occurs when there is a difference in direction between the OBV indicator line and the movement of price. Divergence in most cases signals early trend reversal before price movement will follow.
1- OBV Bullish Divergence
A bullish divergence occurs when the OBV indicator line signals a bullish move, where the current indicator high is higher than the previous, while the movement of price is bearish. This divergence often precedes a bullish trend reversal since the OBV indicator shows the volume flow between the buyers and the sellers in a market.
High-risk-based traders take advantage of the divergence in anticipation of price movement based on volume, while conservative traders wait for the bullish movement indication of price to start.
Consider the chart illustration below
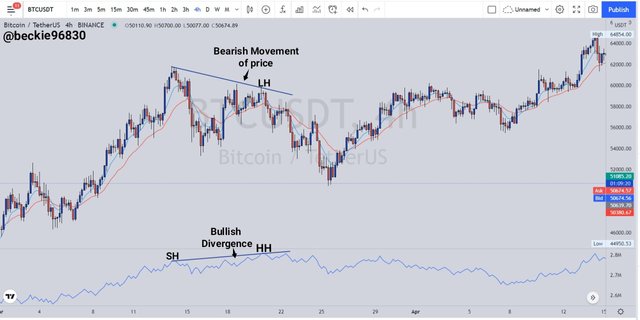
Observing the BTCUSDT chart above, a bullish divergence was formed, where the OBV indicator line printed a sequence of higher highs, while the movement of price formed a sequence of lower highs. As observed, the bullish divergence was followed by a bullish movement of price, which validates the volume inflow.
2- OBV Bearish Divergence
A bearish divergence occurs when the OBV indicator line signals a bearish move, where the current indicator line high is lower than the previous, while the movement of price is bullish. The divergence is followed by a bearish trend reversal since the OBV indicator shows the volume flow between the buyers and the sellers in a market.
High-risk-based traders take advantage of the divergence in anticipation of a trend reversal, while conservative traders wait for the bearish movement of price to start.
Consider the chart illustration below:
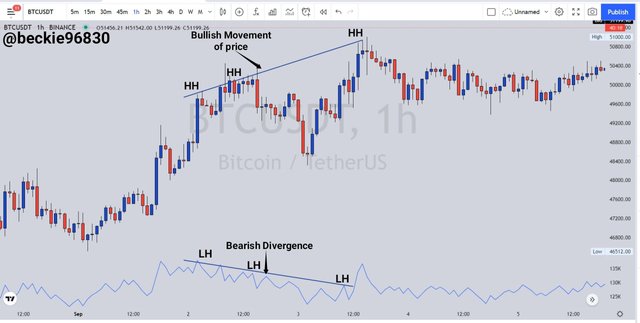
Observing the BTCUSDT chart above, the bearish divergence was formed, where the OBV indicator line formed a sequence of lower highs (LH), while price formed a sequence of higher highs (HH). A short-term bearish move of price preceded the bearish divergence, which validates the volume outflow.

Question 8
Confirm a clear trend using the OBV indicator and combine another indicator of choice with it. Use the market structure to place at least two trades (one buy and one sell) through a demo account with proper trade management. (Screenshots required).
1- Buy Trade ETHUSDT (30 MINS)
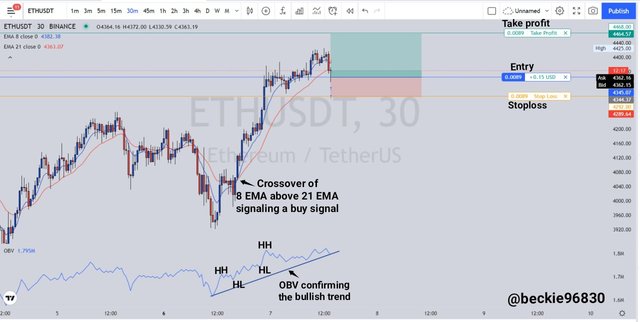
From the ETHUSDT chart above, the Moving average indicator signaled a buying opportunity with the cross of the 8 EMA line above the 21 EMA line. This was also confirmed by the OBV indicator with the formation of consistent higher highs (HH) and higher lows (HL).
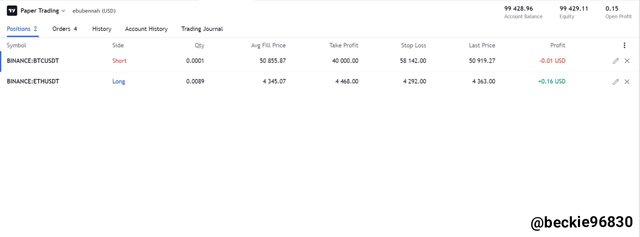
The buy trade position was executed at $4,345.07 with stoploss at $4,289.64 and take profit price at $4,468.00. The trade has a risk to reward of 1: 2 with the Stoploss placed at the precious lows, and the take profit targeting the previous highs.
2- Sell Trade BTCUSDT (DAILY)
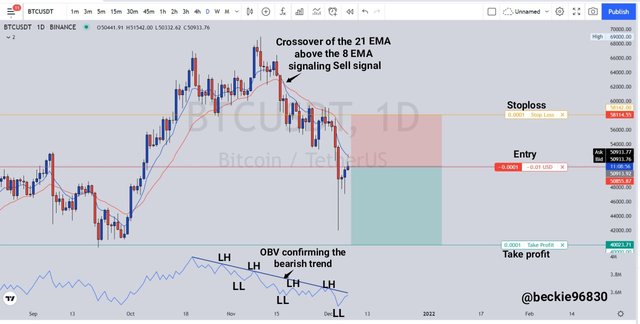
From the BTCUSDT chart above, the Moving average indicator signaled a selling opportunity with the cross of the 21 EMA line above the 8 EMA line. This was also confirmed by the OBV indicator with the formation of consistent lower highs (LH) and lower lows (LL).
The sell trade position was executed at $50,855.87 with stoploss at $58,114..55 and take profit price at $40,023.71. The trade has a risk to reward of 1: 1.5 with the Stoploss placed above the previous Lower high, and the take profit targeting the previous lows.
The executed trade orders

Question 9
What are the advantages and disadvantages of On-Balance Volume Indicator?
Advantages of OBV indicator
The OBV indicator has some advantages which include some of the following:
1- Easy to understand
The graphical representation of the OBV indicator is relatively easy to understand as it contains a single line that conveys the information unlike when compared to indicators like Ichimoku with multiple lines.
2- Trend Confirmation
The OBV indicator helps traders confirm the identified trend and the probabilities of the current trend changing as well as the strength of the trend with the OBV curve formation of higher highs and lower lows respectively.
3- Signals Confirmation
The OBV indicator confirms trade signals with the movement of the volume flow lines either in the same direction as the trend or breakout signals. This is very useful to traders as buy or sell signals can be easily identified.
Disadvantages of OBV Indicator
The OBV indicator has some disadvantages which include some of the following:
1- Lagging Indicator
The OBV indicator is classified as a lagging indicator because of how its values are computed. The values are derived from previous price data which has no direct correlation with the current price movement, ad the previous day's OBV value is used to compute for the current OBV.
2- Late Confirmations
The OBV indicator in some cases confirms trend and breakouts late, which greatly reduce the potential risk to reward ratio to be realized in a trade position.

Conclusion
The OBV indicator works by representing the cumulative volume flow (volume-up and volume-down) in a single line, which oscillates within the volume bound of the asset. On-Balance Volume indicator is a volume-based indicator that is comprised of an oscillating line that indicates the momentum of buying and selling pressure of an asset through its volume flow (volume-up and volume-down) in the traded market.
The OBV indicator can confirm the directional movement of price with the formation of higher highs for an uptrend, and lower lows for a downtrend. This correlates with the principles of demand and supply, where buying pressure creates demand, which forces the price of the asset to increase, and selling pressure creates excess supply, which forces the price of the asset to decline.
Thank you professor @fredquantum for this educative and insightful lesson.