Crypto Academy / Season 3 / Week 2 - Homework Post for professor @yohan2on
Introduction
Fibonacci is believed to be a pattern of sequence observed to be occurring in nature, taking forms in many ways like the mating sequence of rabbits, shapes of leaves, the spiral shape of animals (ex. The shell of a snail), etc. Fibonacci is mathematically expressed using the Fibonacci Numbers. Reference Article
The Fibonacci numbers follow a defined sequence created from the observation of natural events that are represented mathematically with a set of numbers in which a number is the sum of the two numbers before it, starting from the first number 0. The sequence buildup include 0, 1, 1, 2, 3, 5, 8, 13, 21,....Infinity.

Image Source
In finance trading, the Fibonacci tool was developed from this concept to measure the proportion of market retracement, which often correlate with areas of significance (Resistance and Support), since the market structure moves in a waveform.
Note that Fibonacci only works on trending market situations, where consistent highs and lows are maintained.
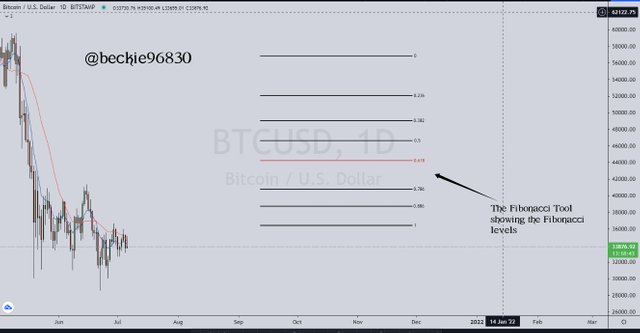
Fibonacci Levels
Fibonacci Levels in trading are levels calculated from the Fibonacci sequence ratios which are used by traders to determine the depth of a retracement that occurs around areas of support and resistance.
The known and used levels of Fibonacci in trading are 23.6%, 38.2%, 61.8%, 78.6%. Although the 50% is included, it is not considered a Fibonacci level because it was not derived from the sequence. Traders often associate the 50% level as a level of a balanced market.
The fibonacci tool in trading consist of a horizontal lines drawn diagonally between points, associated with high points and low points in market structure.
Plotting Fibonacci
Plotting Fibonacci on a price action chart requires an understanding of price movement and market structure, and being able to identify when the market is trending and counter trending.
In general, the points associated with plotting Fibonacci to denote the where to start and where to stop is used as point a and point b (there is no rule backing this, any other value can be used)
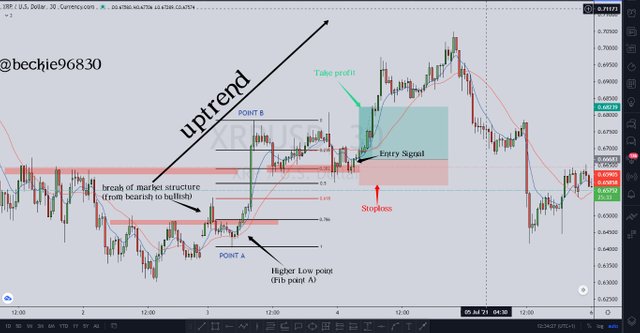
Uptrend Market structure
In an Uptrend market structure, Fibonacci is plotted to measure the retracement/counter-trend move (in this case, the downward move of price against the overall trend).
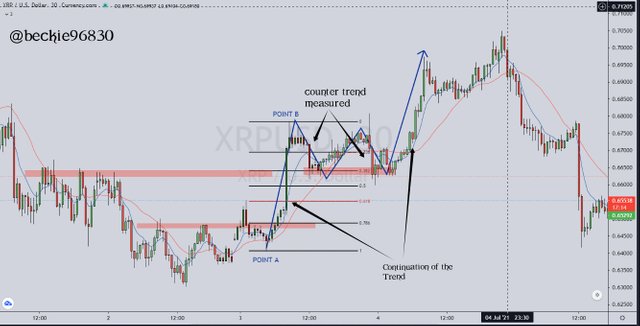
The points are plotted from a low point (higher low point) to the high (current higher high point), to measure the low forming (potential higher low point).
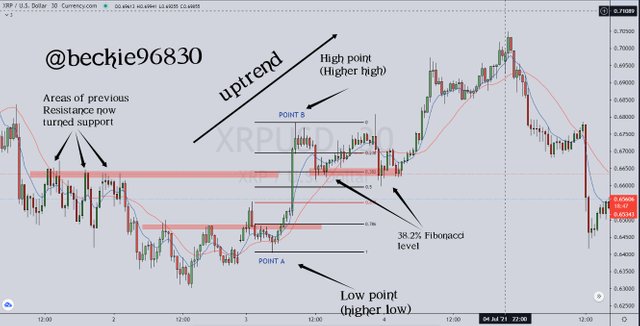
This often corelate with areas of previous resistance now turned support.
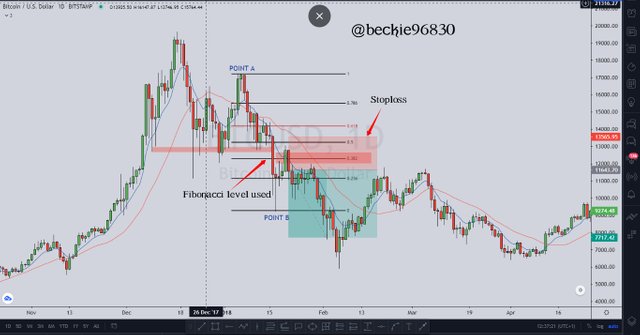
Downtrend Market Structure
In a downtrend market structure, fibonacci is plotted to measure the retracement/ counter trend move (in this case, upward movement of price against overall trend)
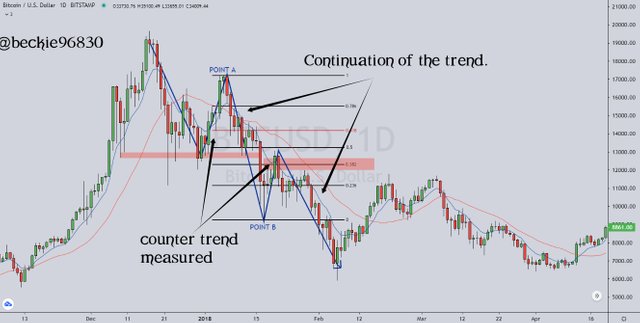
The points are plotted from a high point (lower high point) to the current low ( lower low point) to measure the the high forming (potential lower high point).
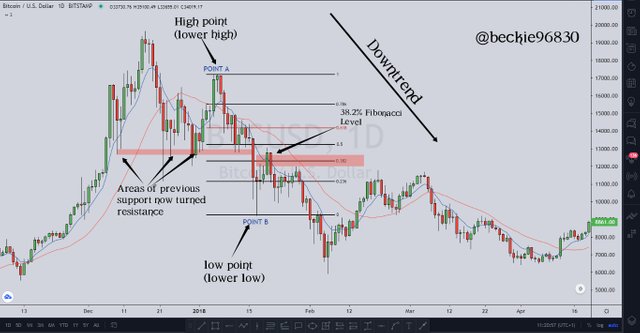
This often corelate with areas of previous support now turned resistance.
Entry and Exit Strategy
Entry and exit of trade using Fibonacci is not ideal way of trading. The Fibonacci should be used with other indicators and price action.
Fibonacci only measures retracement of price and hints on areas of interest (potential areas of support and resistance), the clear signal to take at trade should be based on candlestick pattern and analysis.
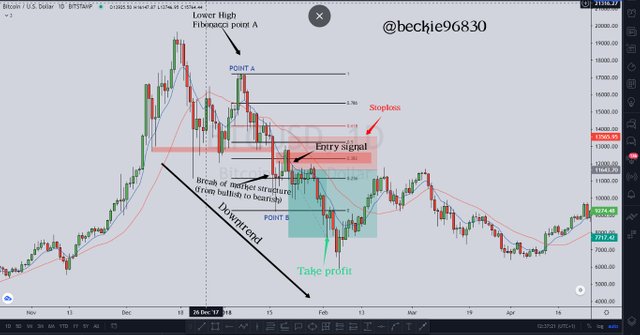
Entry using Fibonacci
To enter a trade based on Fibonacci required that certain criteria have to be seen on the price action chart. They include;
a) Clear market trend (in this case, the market should be in an uptrend/downtrend, identifying highs and lows).
b) The current phase should be a counter trend (the current price movement should be moving in the opposite direction of the trend)
c) plotting Fibonacci from previous highs and lows.
d) wait for price action signals to execute trade (candlestick pattern).
Exit using Fibonacci
Exiting trades using Fibonacci helps traders capitalize on trend continuation and also protects traders from incurring big losses, since the principles of Fibonacci tries to capitalize on the continuation of the trend, the tendency of price continuing in the opposite direction should be considered.
Traders use Fibonacci to set take profit areas and Stoploss areas. This helps keep the trade within risk control.
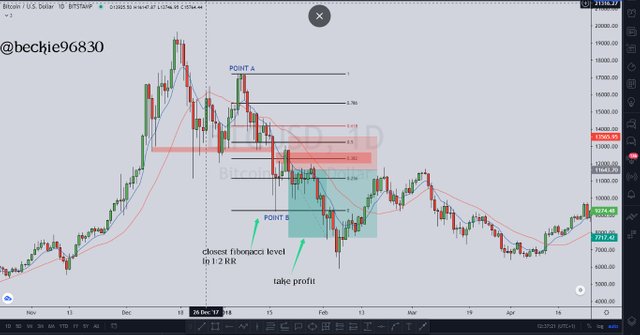
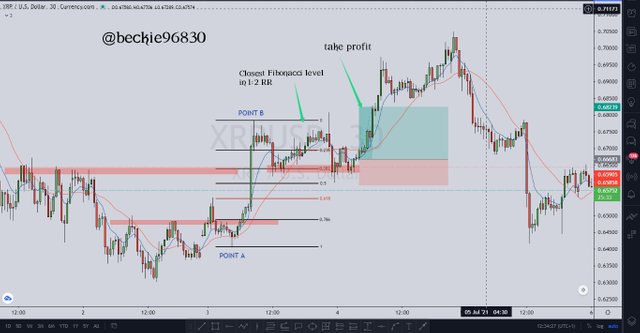
Take Profit Exit
Take profit is a price set that allows traders to secure profit from the market. Conventionally, the ratio of taking profit to Stoploss should be 2:1 thus, increasing the winning stake.
When a take-profit is set, it automatically closed the trade position and adds secured gains to the trader's portfolio.
Fibonacci can be used to determine these areas by setting the price to a level closest to the 1:2 ratio risk to reward.
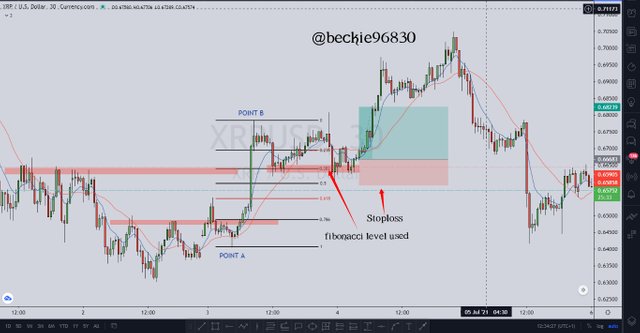
Stoploss Exit
Stoploss is a price set that allows traders to secure their capital in the market. Conventionally, the ratio of Stoploss to Take Profit should be 1:2 thus, increasing the winning stake. Ex. Risking $10 to make $20.
When a Stoploss is set, it automatically closed the trade position and deducts loss from the trader's portfolio.
Fibonacci can be used to determine these areas by setting the price some pips above the Fibonacci level used for entry.
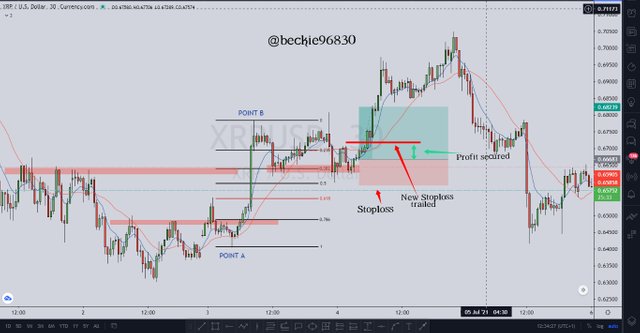
Trade Management
The Fibonacci tool helps traders manage their open positions, by indicating areas of Stoploss placement and trailing Stoploss level in profiting trades.
Stoploss can be set 5-15pips above the Fib level used, depending on other technical indicators aggressive stoploss can be used as well.
Trailing Stoploss allows traders to take advantage of a profitable trade without risking profits made. This is done by moving the Stoploss price to a price in profit( often in line with market structure).
Other Indicator Used with Fibonacci
As earlier stated, Fibonacci works in only trending markets. It should as well be used in confluence with other trading indicators like price action signals (candlestick pattern), moving average (dynamic support and resistance).
Fibonacci only measures the level of retracement in the markets. Other Indicators should align before a bias can be confirmed.
Conclusion
Fibonacci is an important trading tool that indicates the various level of price retracement, since price moves in a waveform. The application of Fibonacci cuts across other sectors and is greatly appreciated.
The application of Fibonacci in trading helps traders confirm trend shift, in confluence with other trading indicators. And also indicating the various level of taking profit and Stoploss to reduce risk exposure and maximize profit potentials through trailing Stoploss.
In general, Fibonacci enhances the trading system if adopted by adding an extra layer of confirmation to the setup seen.
Thank you professor @yohan2on for an opportunity to explore the Fibonacci trading tool.
Hi @beckie96830
Thanks for participating in the Steemit Crypto Academy
Feedback
This is excellently done. Thanks for demonstrating your understanding of the Fibonacci retracement levels in such a clear and detailed way. I like the way you applied the Fibonacci levels on the charts explaining how to use the tool in combination with other technical indicators. Great work keep it up!
Homework task
10
Thank you professor @yohan2on.