Crypto Academy / Season 3 / Week 2 - Homework Post for professor @cryptokraze
Market Structure
Market structure is the graphical representation of price movement of an asset in a specified direction (either uptrend, downtrend, sideways) arranged to convey meaning as to provide opportunities for traders to capitalize on.
The wave-like movement of price creates price-points based on the reaction between buyers and sellers creating swings and forming areas of resistance and support of price.
It is established that price can only move in one of three ways, upwards (uptrend), downward(downtrend), and sidewards (consolidation). The market structure of each of these movement types is different as they represent different market situations.
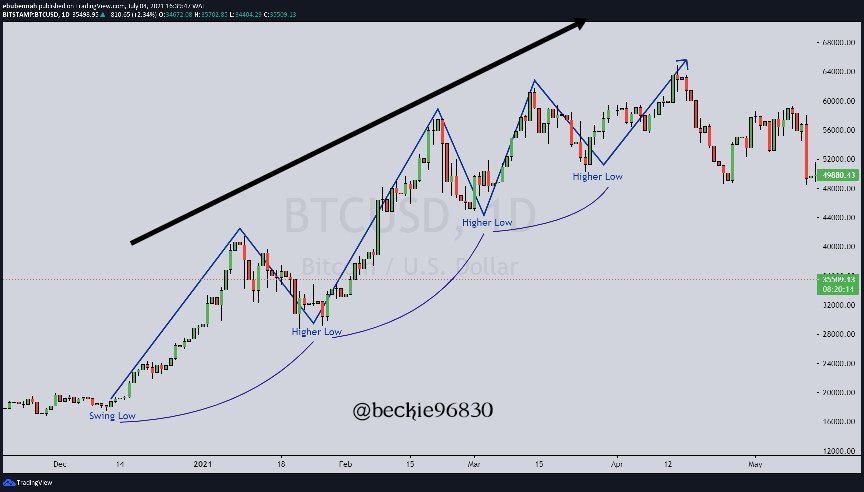
Uptrend Market Structure
Uptrend Market structure is the representation of price movement upwards. Since the market moves in a waveform, It creates a sequence of consistent highs and lows, with the current high moving higher than the previous, this creates the uptrend move of price.

Downtrend Market Structure
Downtrend market structure is the representation of price movement downwards. It creates consistent lows and highs with the current low moving lower than the previous, this creates downtrend move of the price of an asset.

Sideways Market Structure
Sideways market structure is the representation of price movement within a defined range of price. Price creates and resistance and support range and trades within the range until otherwise. It is characterized by defined sideways fluctuation of price.


Concept of Highs and Lows
Price of an asset moves in a wave-like form creating significant points along with its movement. These points created the market structure, and the basis of support and resistance, it also provides a clear perspective on the direction of the market for traders to capitalize on.
These points are classified based on the type of market structure they represent. An uptrend is associated with Higher highs and Higher Lows, whereas a downtrend is associated with Lower Highs and Lower Lows. I will explain each of them below using the BTC chart:
Higher high
A higher-high is an uptrend type of market structure formed from the swing movement of price creating a high that is higher than the previous high created. This validates the upward movement of price, thus creating an uptrend.
It is important to note that, the new high should be significantly higher than the previous high before it can be confirmed as a higher high point. This prevents fakeout and false price action signals.

Higher Low
Higher lows form is an uptrend type of market structure formed at the low points of an uptrend. Since the market moves in a waveform, it creates low points. The higher low is characterized by the current higher low being higher than the previous low.
Higher lows also indicates the start of an uptrend, forming at the bottom of a downtrend, causing a shift in market sentiment.
Lower Highs
Lower high is a downtrend type of market structure formed from the swing movement of price creating a high that is lower than the previous high created. It is characterized by the current high formed being lower than the previous high.
Lower high when formed at the top of an uptrend hints the start of a downtrend causing a shift in market sentiment.

Lower Lows
Lower Low is a type of downtrend market structure formed from the downward swing movement of price creating a low that is lower than the previous. This validates a downward movement of price thus, creating a downtrend.
It is important to note that a new low should be significantly lower than the previous low before it can be confirmed to be a lower Low point. This prevents fakeouts and false price action signals.

Trend Reversal using MSB
The break in market structure often signifies the shift of market sentiment from buyers to sellers or vice versa, this is known as trend reversal. Early trend reversal is characterized by the formation of a lower high and lower low at the top of an uptrend, and the formation of a higher low and a higher high at the bottom of a downtrend.
I will explain further using the BTC/USD chart:
Early Trend Reversal in an Uptrend
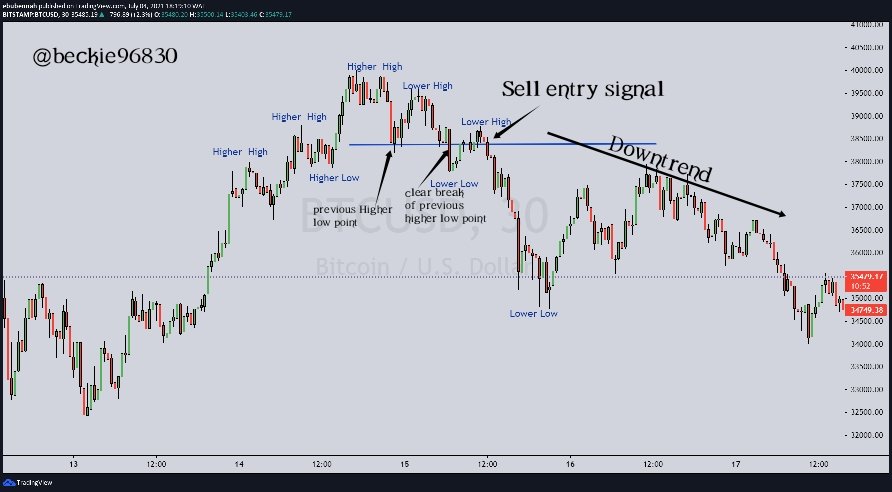
Early trend reversal in an uptrend can be identified with the formation of a lower high and a lower low at the top of an uptrend. The break of the previous higher low point confirms that the trend has changed from an Uptrend to a downtrend.

Early Trend Reversal in a downtrend
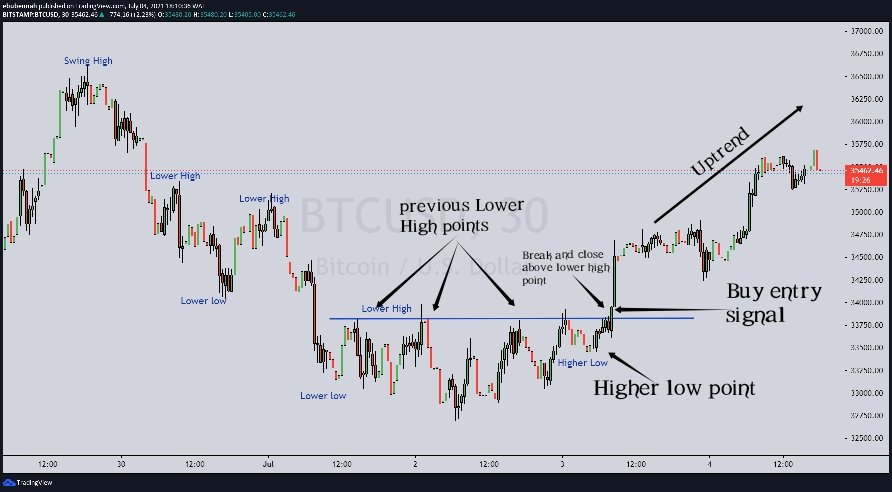
Early trend reversal in a downtrend is identified with the formation of a higher low and higher at the bottom of a downtrend. The break of the previous lower high point confirms the transition of the market structure from a downtrend to an uptrend.

Trade Entry Criteria using MSB
Using the market structure break strategy requires a clear set of rules to be followed before engagement. The rules should be followed in other to avoid trading the wrong setup.
Buy entry criteria:
The required criteria for a buy condition using the market structure break strategy include:
a) The market should be in a clear downtrend, creating lower Highs and lower lows.
b) A clear higher low should be formed.
c) A clear bullish candle breaking and close above the previous Lower high point, thus breaking resistance.
Note that the bullish candle close above the previous lower high indicates the willingness of price to continue upwards, thus shifting market structure
d) place the buy trade after the bullish candle close above the previous lower high point.
Sell entry criteria
The required criteria for a sell condition using the market structure break strategy include:
a) The market should be in a clear uptrend.
b) A clear Lower high should be formed.
c) A bearish candle should break and close below the previous higher low point, thus breaking support.
Note that the bearish candle close below the previous Higher low indicates the willingness of price to continue downwards, thus shifting market structure
d) place the sell trade after the bearish candle close below the previous higher low point.
Trade Exit Criteria using MSB
When a trade is taken, you can exist because of one it two reasons, Your stop loss was hit, or the trade idea has been invalidated. Exiting a trade can be done in three ways:
a) Stoploss hit
b) Take profit hit
c) Manual closing.
Stoploss hit
Stoploss is a predetermined price that is set to protect the traders' capital when the trade idea goes in the opposite direction.
Criteria:
a) The trade should have a Stoploss
b) The stoploss should be placed slightly below the lower low point in a buy trade scenario.

c) The Stoploss show be placed slightly above the lower high point in a sell scenario.

Profit Hit
The take-profit price is a predetermined price that is set in the direction of the trade to make a profit.
Criteria:
a) A trade should have a take-profit price.
b) The take profit should be a minimum of 1:1 Risk to reward ratio.
c) Take profit should be put market structure into consideration.


Place 2 demo trades on crypto assets using Market Structure Break Strategy. You can use a lower timeframe for these demo trades (Screenshots Needed)
Source
For this demonstration, I used the 1-minute chart.
please note: I don't trade with a 1-minute chart alone, setups are faster and easy to find on M1
Demo trade
Setup 1 Litecoin (LTC/USD)
I noticed the consistent formation of higher highs and Higher Lows on M1. Price then form a lower high, I patiently waited for a break and close below the higher low point (neckline), then executed a sell order.

Stoploss and take profit was set in a ratio of 1:2

Setup 2 Litecoin (LTC/USD)
Similar to the first setup, I noticed the formation of higher highs and Higher Lows on M1, Price then form a lower high, I patiently waited for a break and close below the higher low point (neckline), the executed a sell order.

Stoploss and take profits was set in a ratio of 1:3 risk to Reward.


Conclusion
A proper understanding of market structure improves the chart experience of a trader, it is the language of the chart and should be properly understood by traders.
A break of market structure hints at possible trend reversal for traders to capitalize on.
Market structure combined with indicators and other forms of technical analysis improves the confirmation of a setup.
Thank you professor @cryptokraze for this wonderful opportunity to learn.
Good news! ADAX got listed at Coingecko!!!
Still available at Exmarket.
Start doubling your profit now! 🤑🤑🤑
Click here and your In: https://bit.ly/3wQKomF
📲 Follow and Like ADAX Social media links for more Updates:
✔️ https://twitter.com/adax_pro
✔️ https://t.me/adaxcommunity
✔️ https://adax.gitbook.io/adax/
Hello @becky96830
I have a question here
You said 'sell entry'. Is selling an entry or an exit?
Also, you're talking of taking profits at a lower point after you've sold, do you mean you're going to buy the coin at a lower amount?
Thirdly, you show a stoploss higher than the selling point, how do you sell lower than your stoploss?
Thanks.
Hello @jehoshua-shey,
The above example applies to margin trading of crypto asset.
"Sell" in this instance means selling Bitcoin to buy USD (this is a BTC/USD chart ) -hinting a depreciation in the value of bitcoin against the Dollar.
Second Question
Take profit means closing the sell position in profit.
And yeah this create a buying opportunity for the coin at a discounted rate.
Stoploss serves as a safety net - should price move in opposite direction (upwards in this case) the stoploss will close the trade in negative if triggered (this should be within your risk limit)
You mean BTC will be bought again with the USD?
Technically yeah.
Since profit is still in the account.
But I recommend you research on Margin Trading (how foreign exchange market works) it will help you understand it more.
Well, margin trading is still spot, only that the trader is trading with borrowed funds.
It seems you're talking about Forex here, not crypto.
Cheers.
Yeah, that's the crypto crosses I trade.