Crypto Academy / Season 3 / Week 1 - Homework Post for @kouba01

The Ichimoku Kinko hyo Indicator
Ichimoku Kinko hyo Indicator is a weighted technical indicator developed by a Japanese newspaper columnist named Hosoda Goichi in the 1930s. It was derived by combining different technical strategies that existed then, to form a more stable form of technical indicator. The Ichimoku indicator shows various information about the market at a glance (for those familiar with it), which include the direction, momentum, support, and Resistance areas of the traded market and future prediction of resistance and support areas.
The Ichimoku indicator consists of 5 lines that each serve the purpose of enhancing the results of the indicator. They include:
Tenkan-Sen (Conversion Line):
This line is associated with the median price over a period of 9. It is calculated by determining and adding the highest price and the lowest price over a period of 9 and divide the number by 2. It shows the mid-price over a period of 9 and is used in confluence with other Ichimoku lines to determine the short-term trend and possible short-term signal for traders.
Due to its short period, the Tenkan-sen line moves closely with price, predicting short-term trends, dynamic support, and resistance areas with its curves.
The Tenkan-sen line forms a flat price representation when the highest price and lowest price fluctuate within close ranges because the median across the period will be of almost similar values.
Kijun-Sen (Base Line)
The Kijun-Sen Line is also a median price point indicator like the Tenkan-Sen line, but the difference being that it's calculated over a period of 26 candles. The calculation formula is highest price point + lowest price point divided by 2 across a period of 26. Due to its longer period, it is used to determine medium-term trends when used in confluence with other Ichimoku Lines.
The Kijun-Sen line indicates longer trends than the Tenkan-sen line. When the price is trading above the Kijun-Sen line, the trend is up. When the price is below the Kijun-Sen line, price movement is downward.
Similarly, the Kijun-Sen forms flat price representation when prices maintain close high price points and low price points.
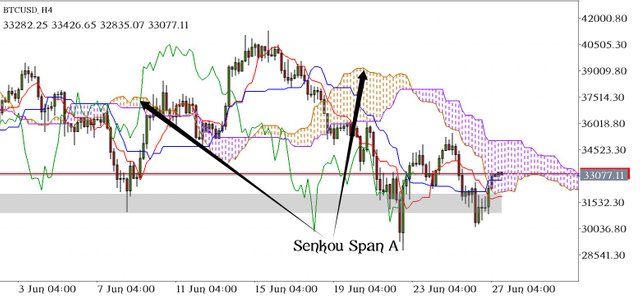
Senkou Span A (Leading Span A)
Senkou Span A is part of a two-piece line that forms the border of the cloud in the Ichimoku indicator. It is used with the other Senkou Span(B) to project potential areas of resistance and support usually in 26 periods. It's calculated by adding the value of the conversion line to the base line and divided by two and plotted in a period of 26 into the future. Thus, Conversion line value + Baseline value/2.
Though Senkou Span A is plotted from previous market data, it predicts possible future areas of interest. This defines its predictive nature and importance in the Ichimoku indicator.
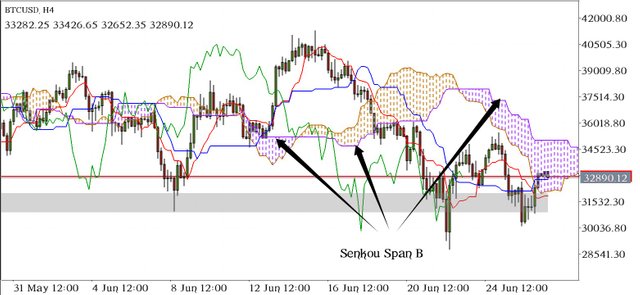
Senkou Span B (Landing Span B)
Senkou Span B is the second border that forms the Ichimoku cloud with the other Senkou Span (A). Similarly, it is plotted into the future in a 26 period to predict potential resistance and support areas. The calculation is different, it is calculated by determining the highest price in a period of 52, added to the lowest price over a period of 52, divided by 2 thus, Highest price over a period of 52 + Lowest price over a period of 52 / 2.
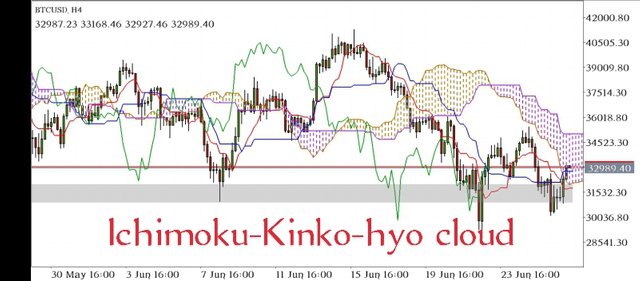
The section covered by the Senkou Span A and B Line is generally known as Cloud or Kumo in Japanese. The cloud is used as resistance and support areas, when the price is above, the cloud indicates support areas. When the price below, the cloud indicates resistance areas along with the trend.
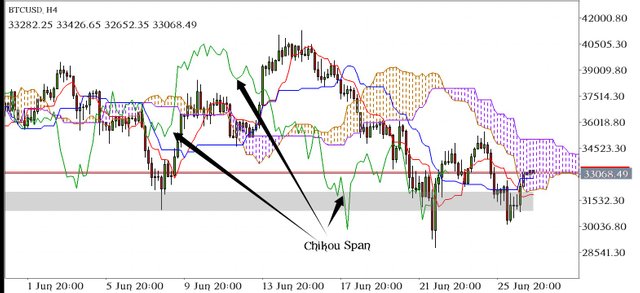
Chikou Span (Lagging Span)
This is the last piece that makes up the Ichimoku indicator. It's called the lagging line because it is plotted in a period of 26 after the close of the recent price. The lagging span plots the closing price 26 periods behind the currently closed price to show the relationship between the previous and current trend and also predict trend reversals.
Chikou span indicates price direction using past closed market data. If the chikou line is above market price, this shows the market movement is to the upside. And if the Chikou Span line cuts through price downwards, the price movement is seen as down. Traders use Chikou span to identify a potential trend change.
Adding Ichimoku indicator to your chart:
Depending on your trading platform, adding the Ichimoku indicator may vary. In my case, I'm using the MetaTrader 4(mt4). To add Ichimoku indicator on mt4:
- open the indicators menu
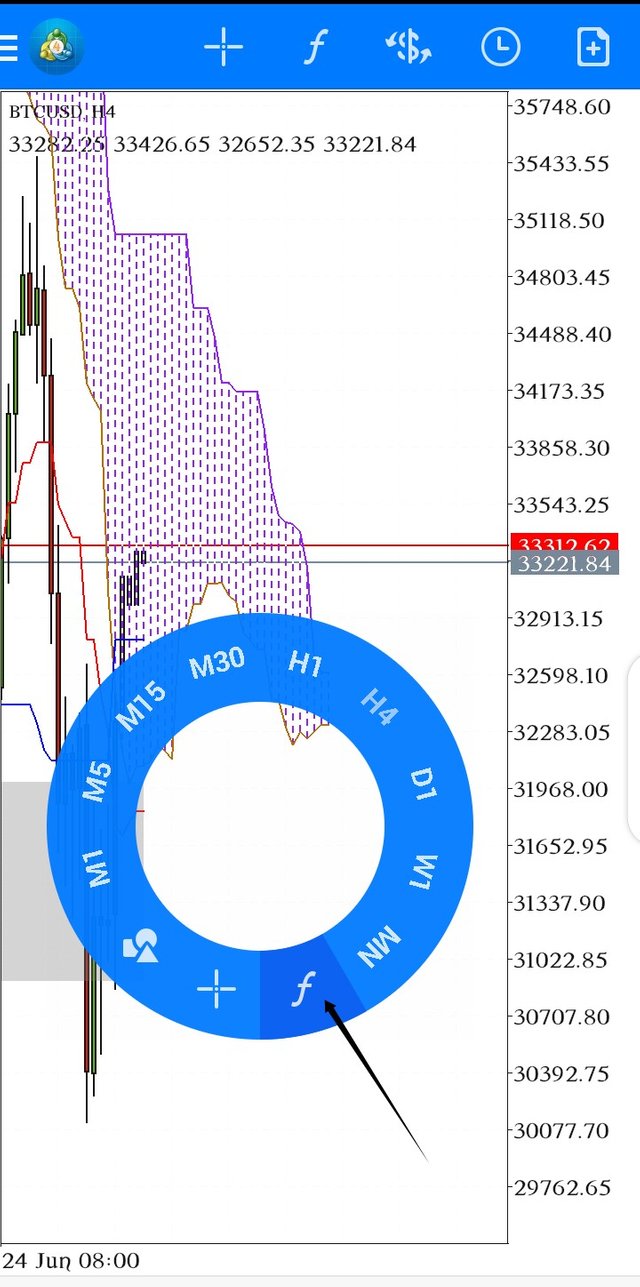
- Then, select Ichimoku from the list of indicators shown.
- press done.
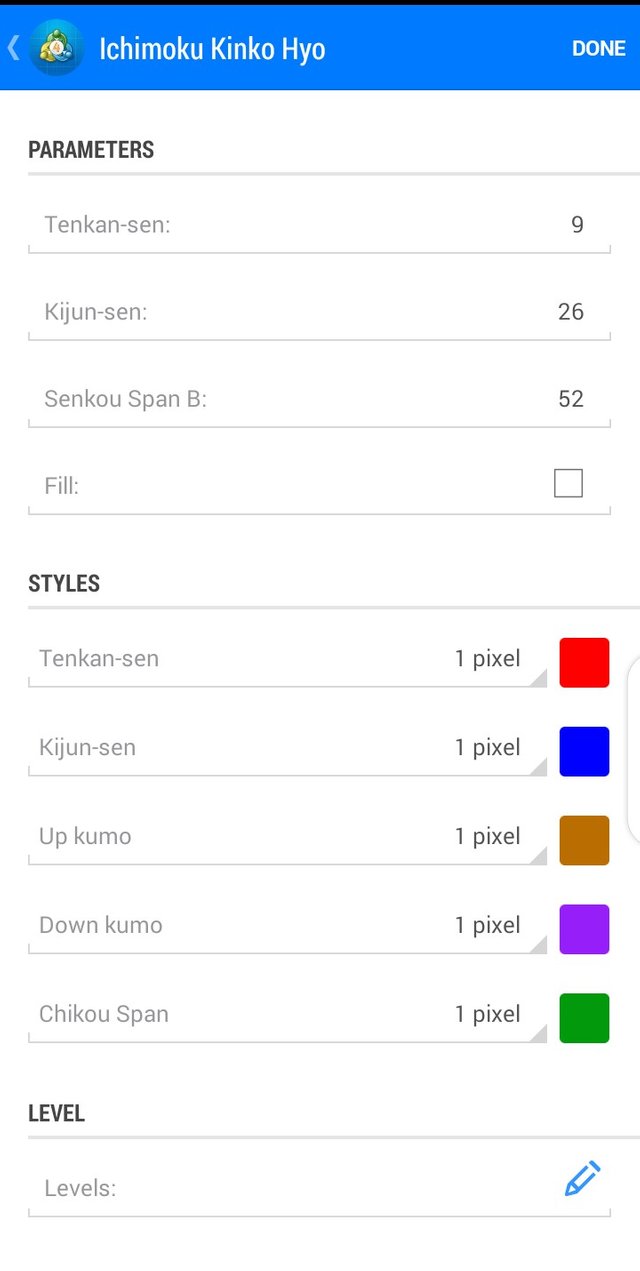
Default Ichimoku Settings:
The indicator has a default setting of 9, 26, 52 periods for Tenkan-sen, Kijun-Sen, and Senkou Span B respectively.
As stated in the lecture by professor @kouba01, the values of the period may vary as it is dependent on values represented by obtainable economic activities. It's advised to twerk the values to suit the system being traded.
Various regions have different economic conditions peculiar to them, having a proper understanding of the region and its policies would help traders change the parameters to suit their trading system.
Using the Ichimoku indicator
The wide adoption of the Ichimoku indicator by traders refers to its completeness as an indicator. It predicts possible price movements(trends) and reversal points. Furthermore, I will be explaining how to use the lines to confirm a bias in trading.
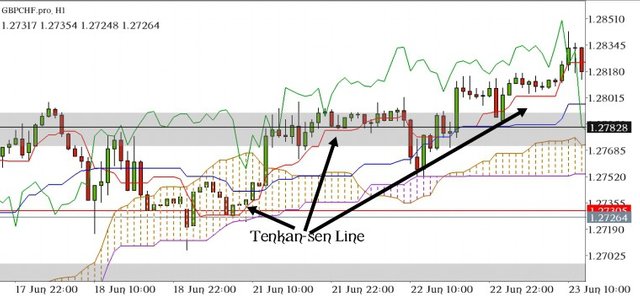
Using the Tenkan-sen Line:
The Tenkan-sen line is known for its short-term prediction of price movement over a period of 9, across any timeframe used. It shows the median price within the period of 9. Conventionally, when the price is above the Tenkan-sen like it is assumed that the short-term movement is up, likewise when it is below the line, it's assumed the short-term movement is down. But it is usually used in conjunction with the Kijun-Sen Line to make better decisions.
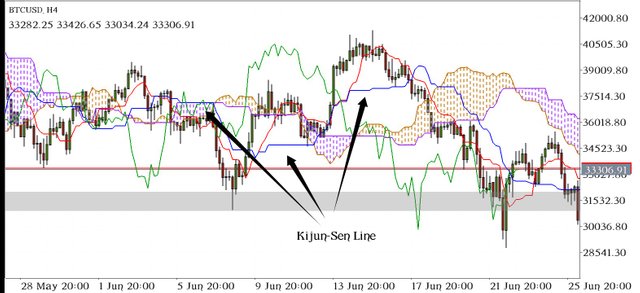
Using the Kijun-Sen Line:
Similarly, the Kijun-Sen line shows the median price but over a period of 26 across any timeframe used. By itself, it predicts the medium-term movement of price. If the current price is above the Kijun-Sen line, the medium-term movement is up likewise, if the price is below the Kijun-Sen line, then, the medium-term movement is down. But the Kijun-Sen line is often used with the Tenkan-sen line to determine a stronger price direction as it accounts for short-medium time movements of the price.
Using Tenkan-sen and Kijun-Sen simultaneously:
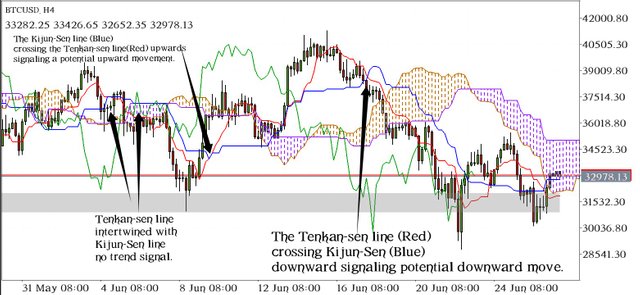
Using the Tenkan-sen line and Kijun-Sen line together is the best way to get a better result from the indicator, as both lines account for short and Medium direction of price from the median price and periods respectively. When the Tenkan-sen crosses the Kijun-Sen line downward, it is seen as a potential down price movement and thus a shorting signal.
Similarly, when the Kijun-Sen crosses the Tenkan-sen line upward, it is seen as an up price movement and potential long signal.
The absence of a trending market is often represented by the Tenkan-sen line being intertwined with the Kijun-Sen like indicating no actual direction, often referred to as consolidation in technical analysis.
chikou span line:
The Chikou Span line also called the lagging span is a part of the Ichimoku indicator that shows the relation between the current market trend and previous trends. It is gotten from plotting the closing of the last 26 period after the current price close.
Using the Chikou Span:
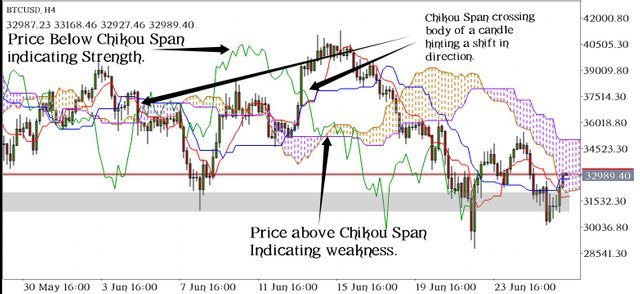
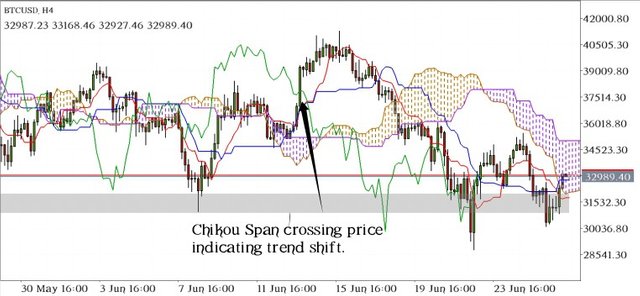
The main use of Chikou Span is to show the relationship between current price and price history. When the price is above the Chikou Span, it shows less strength in the commodity traded. Likewise when the price is below the Chikou Span, which indicates strength in the traded commodity. A cross between the Chikou Span and the bodies of candles signals a possible shift in direction of the market.
Why is it often neglected?
Source
The Chikou Span is neglected because it only shows the relationship between price history and current price being plotted by price closing, this means that its basis is built on previous market data and close prices. This has no direct hint on the future predictions and direction of the market. Ideally, the Chikou Span crossing price (candle bodies) might hint at possible trend reversal, it often generates false signals, the steep move of price in a new direction.
Best Timeframe to use Ichimoku indicator on
The Ichimoku indicator works across all timeframes. It all depends on the type of trader and trading strategy/system. An Intra-day trader will likely focus on Ichimoku signals generated on H4, H1, and other Lower timeframe. Likewise, a scalper will focus on signals generated from H1 down to other Lower time frames.
Ichimoku indicator signal is generated according to the price movement on all timeframe.
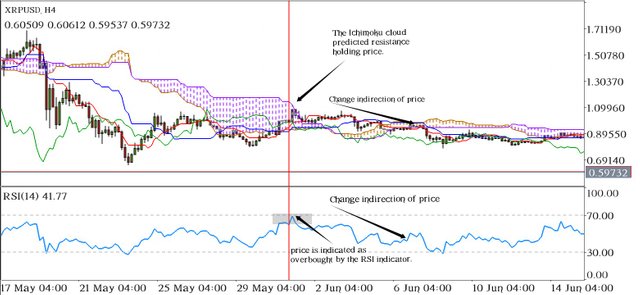
Indicators combined, provide more confirmation to determine bias in the market. Ichimoku is paired with RSI (Relative Strength Index) which is an indicator that shows overbought and oversold conditions in the market. The two indicators hinting the same directional bias increase the probability of a setup. The confluence between price action signals (candlestick formations) and technical indicator signals provides higher probability setups.
Conclusion
Ichimoku is a good technical indicator that shows strong support and resistance level, the direction of the market, and future support and resistance area. Ichimoku can be used on any timeframe and integrated into any trading system. Using indicators and price action increases the probability of a determined trade setup.
Although Ichimoku is called a complete indicator, it's not right to use an indicator signal alone.
Thank you @kouba01.
Hello @beckie96830,
Thank you for participating in the 1st Week Crypto Course in its third season and for your efforts to complete the suggested tasks, you deserve an 8.5/10 rating, according to the following scale:
My review :
Good article in which you were able to answer all the questions efficiently and with a clear methodology, but some points lack a certain depth of analysis.
Thanks again for your effort, and we look forward to reading your next work.
Sincerely,@kouba01
Thank you professor.