[Basics to trade cryptocurrencies correctly, Part 1] - Crypto Academy / S6W1 - Homework post for professor @nane15

Question 1
What do you understand by trading? Explain your understanding in your own words.
Trading
The term trading in the finance ecosystem refers to the processes involved in the activities of exchanging (buying and selling) assets, commodities, cryptocurrency, etc, for the sole purpose of making profits. This is achieved by capitalizing on the price differences of an asset at a given interval, in speculation of either an increase or a decrease in the price of the asset, following the principles of demand and supply.
The concept of trading works by capitalizing on the price differences of assets, where an investor aims to buy at a discounted price and sell at a higher price, this ensures that the investor makes a profit from the trade executed, thus resulting in a positive portfolio balance. For trading to be effective, the price of the traded asset has to change periodically.
As observed in the crypto markets, the prices of crypto assets tend to change rapidly, which indicates the interaction between buyers and sellers in the form of demand and supply, and the liquidity level of the market, which determines how fast trade order can be executed i.e how fast a buy or sell order can be executed. Following the demand and supply principle, buyers and sellers contribute to the overall movement of the price of an asset, such that buying the assets creates demand which in turn force the price of the asset to increase, and selling the asset creates supply which in turn force the price of the asset to decrease.
Trading Analysis
To effectively trade the financial market, investors and traders need to understand the various elements of the market which affect the pricing of assets traded. To understand this, various types of analysis can be conducted to grasp the directional flow of the market, and they include:
1- Technical Analysis
Technical analysis refers to the use of graphical tools like charts, patterns, indicators, algorithms, and price action to study historical price data in an attempt to predict possible price movements. This type of trading analysis is used for both short-term and medium-term trading following repeating patterns of price movement to capitalize on potential opportunities.
2- Fundamental Analysis
Fundamental Analysis involves the evaluation of quantitative economic data, news, policies, and how it impacts the price of correlating assets in the market. In the crypto ecosystem, fundamental analysis plays an important role in evaluating the state of the crypto market as various factors like, project updates, government policies, crypto whale news, all induce price fluctuation. Also, fundamental analysis aids the success of a project, this is because the analysis provides insights how the developers of the project, their road maps, and what they wish to achieve in long term.
3- Sentimental Analysis
Sentimental analysis refers to individual perception of the market, it involves the generalized ideology of the market as experienced by different investors. Sentimental analysis is induced and controlled by a human mechanism like emotions, greed, fear, doubt, etc, which directly impact the trader's ability to make a logical decision over emotional decisions.

Question 2
What are the strong and weak hands in the market? Be graphic and provide a full explanation.
Strong Hands in the Market
Strong hands refer to investors and market speculators with huge investment capital used in trading activities. This category of investors is comprised of institutional investors, hedge funds, or private equity firms whose trade execution impacts the pricing of an asset because of the volume of cash pumped into the market. In the crypto ecosystem, these types of investors are referred to as whales, who because of their purchasing power can manipulate the price of an asset.
Strong hand investors create trends through accumulation and distribution of trade order. This is done by executing large trade orders in a specified direction which in turn creates massive demand or supply of the traded asset resulting in an increase or decrease in the price of the asset.
During accumulation, strong hand investors infuse huge capital into the market at low prices through large purchase of the asset, this increases the demand for the asset causing an upward movement in the price of the asset, this cycle is repeated till the desired price level is attained.
While during distribution, strong hand investors take out cash from the market in form of profit-taking at high prices, through selling the previously purchased asset. This results in excess supply of the asset forcing the valuation of the asset to reduce.
To illustrate, consider the chart below:
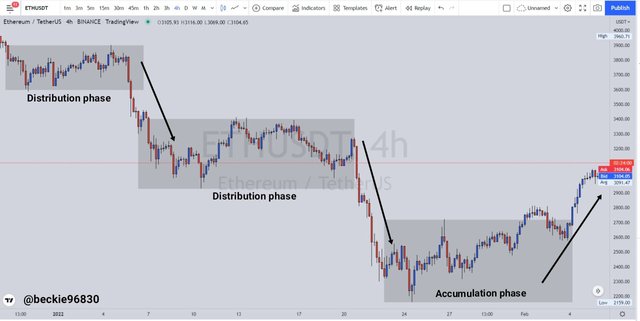
Observing the chart above, profit-taking occurred at the top distribution phase, which led to the decline in the price of ETH. Another distribution phase was encountered, where more strong hand investors pulled money off the market, creating an excess supply of ETH, which led to a further decline in the price of ETH.
At the low prices, an accumulation phase was seen, as strong hand investors infused money into the market, which led to the seen increase in the price of ETH back to the previous distribution zone.
Weak Hands in the Market
Weak hands refer to investors and market speculators with small investment capital used in trading activities. This category is comprised of organizational investors, retail funds, or private individuals whose trade execution has very little to no impact on the pricing of an asset because of the small volume of cash used in the market. Weak hand investors try to emulate the trading game or strong hand investors, but in some cases, weak hand investors get trapped because of volume manipulation techniques used by strong hand investors, usually in form of fakeouts.
Question 3
Which do you think is the better idea: think like the pack or like a pro?
In my opinion, thinking like a pro is the better idea. The Pro investors (strong hand) has the ability to push the price in the desired direction, giving them the ability to manipulate price. The best approach is to try and emulate the Strong investors game by only trading when the clear trend has been identified and avoiding random news that pushes price temporarily. Thinking and trading like a pro involve mastering techniques and skills that disregard emotion-based trading, as strong hand investors trade based on logical facts seen on the price chart.
Following a strong hand trading system that coincides with the principles of demand and supply, strong hand investors primarily buy a huge number of assets at a discounted price and sell at higher prices, this ensures that profit is secured within the trading interval. A weak hand investor applying these same principles in his trading is simply thinking and playing like a pro!.
Question 4
Demonstrate your understanding of trend trading. (Use cryptocurrency chart screenshots.)
Trend Trading
The concept of trend is an important component of trading that indicates the direction of the price of an asset within a specified interval, thus understanding trend movement is necessary to be a successful trader. In other to identify trends, investors utilize trend indicators that make it easy to identify trends and further capitalize on a possible trade setup. To demonstrate this, I Will explain trend trading using the Eliott wave pattern.
Eliott wave and Trend Trading
The Eliott wave indicator is a trading tool used by investors to identify trends using extreme peaks and lows of price movement, while also identifying impulse moves within the trend. Eliott wave is comprised of two waves: Impulsive wave and corrective wave, where the impulsive wave is comprised of 5 micro waves (where waves 1,3,5 are impulsive moves and waves 2,4 are corrective moves) and the corrective wave is comprised of 3 waves (here wave a,c are impulsive moves and wave b is a corrective move).
To understand the Eliott wave formation properly, there are some rules to be followed, they include:
1- Wave 2 of the impulsive wave must not move below the low point of wave 1 of the impulsive wave.
2- Wave 3 must not be the shortest between waves 1, 3, and 5 of the impulsive wave.
3- wave 4 must not move beyond the low point of wave 3 of the impulsive wave.
To illustrate this, consider the chart below:
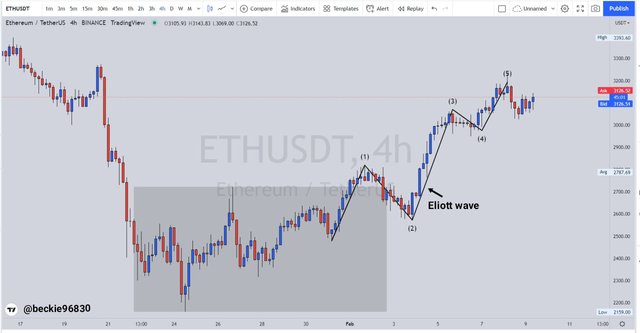
Observing the chart above, the Eliott wave rules were satisfied, where wave 2 did not move beyond the low point of wave 1, and wave 3 is larger than wave 1 and wave 5. Also, wave 4 did not move below the low point of wave 3.
The principle of the Eliott wave follows the overall trend structure of a bullish trend, where consistent higher highs and higher lows are maintained to form a bullish trend.
Question 5
Show how to identify the first and last impulse waves in a trend, plus explain the importance of this. (Use cryptocurrency chart screenshots)
Identifying First and Last Impulse waves
The terms first and the last impulse refer to the corrective phase of the Eliott wave pattern, where the first impulse indicates that start of a trend characterized by a break above or below Wave a by Wave c in trending markets respectively, and the last impulse indicates the end of the corrective phase which occurs when the high of Wave c is broken.
Identifying First Impulse Move
The first impulse is characterized by starting off a new wave trend. To identify the first impulse, identify the Wave 5 of the previous Eliott wave, and observe the line formed from Wave b, which should be higher than the low of the Wave 5. Next observe the line formed from Wave c, such that if the Wave c line break and close above the high of Wave a, thus moving higher than the previous lower high, it is considered the first impulse move.
Following the principles of price action, the first impulse move is considered a break of market structure, which transactions the market from a bearish sentiment to bullish sentiment. Consider the chart below:
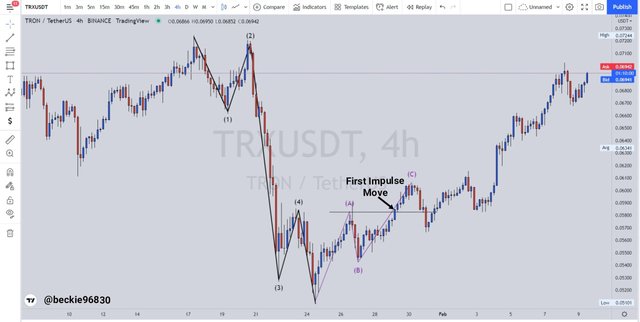
Observing the chart above, the first impulse formed when the price broke and closed above the high of the previous lower high (Wave a). This confirms the shift in market sentiment from bearish to bullish.
Identifying Last Impulse Move
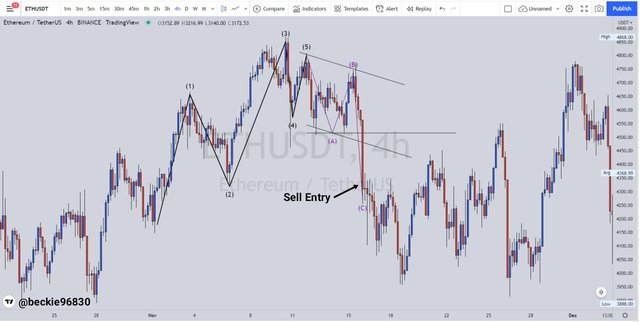
The last impulse is characterized by end of a counter wave trend. To identify the first impulse, identify the Wave 5 of the previous Eliott wave, and observe the line formed from Wave b, which should be lower than the high of the Wave 5. Next observe the line formed from Wave c, such that if the Wave c will not break and close below the low of Wave a, thus moving higher than the previous lower high, as seen in the follow-up price. Consider the chart below:
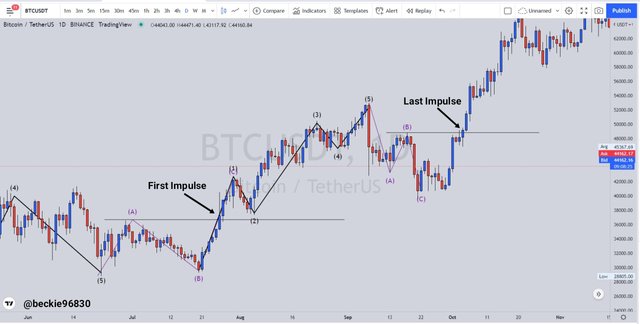
Observing the chart above, the last impulse occurred when the price closed above the corrective wave high (wave a), this implies a bullish trend continuation after the corrective move occurred.
Question 6
Show how to identify a good point to set a buy and sell order. (Use cryptocurrency chart screenshots)
Buy and Sell Points Using Eliott Waves
Identifying trading opportunities using Elliot wave all depends on the trader's ability to identify trends and combine multiple indications to build confluence. To use the Eliott wave correctly in identifying the trading opportunities, the following steps should be followed:
In an uptrend, after identifying the Wave 5 of the impulsive wave, and spotting the Wave c closing above the high point of wave a, draw a parallel line from the low point of wave 5 to the low point of wave a (which should be a higher low), then wait for price to close above the drawn parallel line to execute a buy trade order. Stoploss should be placed just below the wave a low and take profit should target the nearest resistance level.
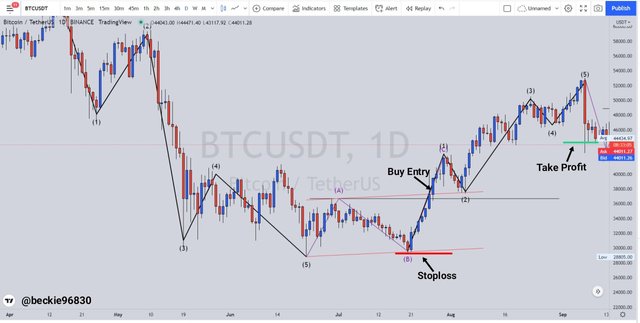
Observing the chart, a buy trade order should be executed after the parallel line drawn at the top of the wave is broken. This ensures safer trade entry from the impulsive breakout.
Similarly, in a downtrend, first, identify Wave 5 of the impulsive wave, and wait for the price to close below the low of wave 5. Next is to wait from the corrective wave a to form and at the top of wave a, a sell trade order can be executed. Stoploss should be just right above the newly formed resistance, and take profit targeting the lows of wave a.
Observing the chart, a sell trade order should be executed after the parallel line drawn at the low of the wave is broken. This ensures safer trade entry from the impulsive breakout.
Question 7
Explain the relationship of Elliott Wave Theory with the explained method. Be graphic when explaining.
Eliott Wave and Wykcoff Method
Eliott wave and the Wyckoff method share certain principles relating to trend trading, this is evident as the accumulation and distribution zones of the Wyckoff method correlate with the corrective wave of the Eliott wave. This observed similarity hints at the starting of a new trend.
Using the Eliott wave, the corrective waves hint at the beginning of a new trend when the price closes above or below the peak or low of the Wave a high or low point, this also correlates with the principles of price action, which implies that a higher low or lower high point should be violated before a trend reversal can be seen.
Similarly, the Wyckoff method uses the accumulation and distribution phases to indicate the possible area of price reversal and trend continuations. This method can be combined with price action to improve the accuracy of trend trading forecasts. Though, the Eliott wave and Wyckoff method can be used together to form strong confirmation on a trade sentiment. To illustrate this, observe the chart below:
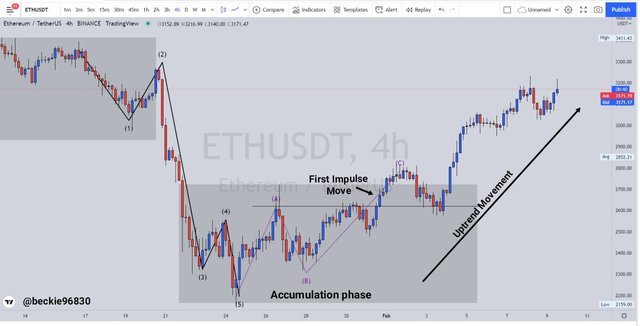
From the above chart, Eliott wave and Wyckoff hinted at the trend reversal from bearish to bullish, with the Eliott wave's first impulse move occurring at an area price accumulation. This gives a strong indication that strong hand investors could possibly be accumulating trade orders at these price levels.
Conclusion
Trading works by capitalizing on the price differences of assets, where an investor aims to buy at a discounted price and sell at a higher price, this ensures that the investor makes a profit from the trade executed, thus resulting in a positive portfolio balance. For trading to be effective, the price of the traded asset has to change periodically. Eliott wave indicator is a trading tool used by investors to identify trends using extreme peaks and lows of price movement, while also identifying impulse moves within the trend. Though the Eliott wave and the Wyckoff method share certain principles relating to trend trading, this is evident as the accumulation and distribution zones of the Wyckoff method correlate with the corrective wave of the Eliott wave.
Thank you professor @nane15 for this educative and insightful lesson.