Steemit Crypto Academy Season 4 - Homework Post for Task 10 for @reminiscence01 submitted by @beautybb 7/10/21
2a) In your own words, explain the candlestick patterns and their importance in carrying out effective technical analysis.
b) In your own words, explain the psychology behind the formation of the following candlestick patterns.
Bullish engulfing Candlestick pattern
Doji Candlestick pattern
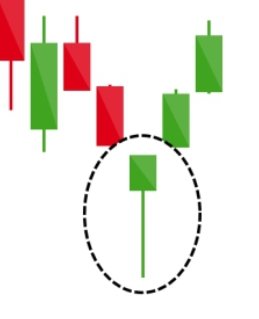
The Hammer candlestick pattern
The morning and evening Star candlestick pattern.
The Harami Candlestick pattern.
In your own words, explain the candlestick patterns and their importance in carrying out effective technical analysis.
Candle stick pattern are technical treading tools that traders look out for when it when it comes to determination of price direction of an asset, and this candle stick pattern consist of three line sticks:
- Three black crows.
- Two black gapping.
- Morning and evening star.
Candle sticks pattern helps traders to make a good decision because this patterns occurs regularly in trading charts.
Candlestick patterns also helps to show reversal as well as prediction of changes in price direction .
Bullish engulfing Candlestick pattern
The physiology behind the formation of bullish engulfing candlestick is to help traders indicate a reversal of price movement and know when to buy and when to sell.
Doji Candlestick pattern
Doji candlestick pattern helps to show when prices are open and when they are closed especially at the same price,which will make it difficult for both the buyer and the seller to have control over the market price.
More to that Doji has three major types:
- The Gravestone.
- The Long-legged.
- The Dragon -fly.
The Gravestone happens to be a bearish reversal candlestick pattern that shows up the opening, the closing and the low prices especially when they very close to each other suggesting reversal on an uptrend.
The Dragon-fly is the opposite of the Gravestone because it is a bullish reversal pattern and it occurs in a downtrend.
In conclusion Doji candlestick is simply an indication that both that both buyers and sellers has no control on price action and can not push it higher or lower, so on this note it is encouraged that traders wait for a new formation of another candlestick.
The Hammer candlestick pattern
The Hammer candlestick occurs after price declines and its an indication of a potential upside reversal, it has a T shape.
It also has a long wick which indicates strong price rejection from buyers.
Hammer candlestick indicates support and resistance levels.
In conclusion Hammer candlestick pattern helps the trader to take profit or look for potential selling positions.
The morning and evening Star candlestick Pattern
The morning star candlestick consists of a tall black candlestick, a smaller black or white candlestick with short body and a long wick .
The middle candle helps to indicate market indecision where the bears begin.
The third candlestick indicates reversal and also a mark of new uptrend.
The morning stars candlestick pattern helps the sellers be in control of the price till the buyers takes over from the sellers,and in a downtrend morning star candles are strong bullish reversal candlesticks with strong signal in the support area.
The Evening star is the opposite of the morning star.
The Evening star is a strong bearish reversal candlestick that forms resistance level, and it is made up of 3 candles just like the morning star
- The first candle is a bullish candle that shows that buyers are in control of price.
- The second happens to be a small Doji candle which shows the weakness of the buyers and their inability to push prices higher.
- The third candle is a long bearish candle engulfing the previous Doji candle indicating the authority of sellers over price action.
In conclusion in the Evening star candle the buyers are in control till the sellers took over.
The Harami Candlestick pattern
The Harami candlestick pattern is also a reversal candlestick pattern that also gives traders signal as to when price reversed or continues in its original price.
Harami is made up of two candles
- A bullish sticks helps the traders to know when the bearish trend its coming to and end helping the traders to know when to enter a long position of trading asset.
- The bearish Harami candlestick also shows when the price will reverse to the down side, it has a long white candle followed by a small black candle.
Conclusion
With my little knowledge i have learned that for this candlestick pattern to work well a trader needs to combine them with other technical analysis like indicators to get best results.
A trader should also be careful to fetch out those candlesticks before making trading decisions.
A trader should also know the areas those candlestick are formed, if it is on resistance or support level, if it is on overbought or oversold area, to get an exact price action.
A trader should know the sizes of those candlestick patterns to know when the buyer or the seller is in control of the market price.
Traders should also know the anatomy of any candlestick,both the opening and closing prices the higher and the lower of any candlestick this will help them to know the strength of the market and who is in control of price.
With all this necessary knowledge and information a trader will make a successful trading.
Thank you @reminiscence01
