Steemit Crypto Academy Season 3- Dynamic Course for Beginners - Week 7 from @lenonmc21 submitted by @beautybb 13/8/21
Homework

Theory (No image)
Define in your own words what is the Stochastic Oscillator?
Explain and define all components of the Stochastic Oscillator (% k line,% D line + overbought and oversold limits).
Briefly describe at least 2 ways to use the Stochastic Oscillator in a trade.
Define in your own words what is Parabolic Sar?
Explain in detail what the price must do for the Parabolic Sar to change from bullish to bearish direction and vice versa.
Briefly describe at least 2 ways to use Parabolic Sar in a trade?
Practice (Only Use your own images)
It shows a step by step on how to add the Stochastic Oscillator to the chart (Indicating the% k Line and the% D Line, the overbought and oversold zone.
Show step by step how to add Parabolic Sar to the chart and how it looks in an uptrend and in a downtrend.
Add the two indicators (Stochastic Oscillator + Parabolic Sar) and simulate a trade in the same trading view, on how a trade would be taken.
My entry
Define in your own words what is the Stochastic oscillator?
Stochastic oscillator is one of the technical indicator used by traders to indicate price range, it also shows the location of prices in both bearish and bullish trend and is calculated with the price range of a period of 14days.
Stochastic oscillator helps to find out overbought and oversell, it works well in dictating resistance and support, and this makes it productive for traders.
Stochastic oscillator was developed in late 1950,s by Goerge lane,it ranges from 0-100 and this makes it easy to dictate the overbought and oversold as i will show in the image below.
Explain and define all components of the Stochastic Oscillator (% k line,% D line + overbought and oversold limits).
Stochastic oscillator composes of two
different components:% K line
and % D line.
Now lets define and explain how both component are being calculated
% K line represent stochastic itself and it is a fast moving average that draws persistently and helps to dictate buy and sell signal, when i applied this indicator a blue line appeared below my chart, and there is another red line which signifies the three period moving average of the % K line and that red line is referred to % D line.
Lets me show the formula:
% K =C-L14/H14-L14×100
C -means the recent closing price
L14-means the lowest price traded in a period of 14days
H14-means the highest price traded in the 14,days period.
K-means current value of the indicator.
Lets calculate:
% K =current closing price subtracted by the lowest price in a 14 day period /the highest price in same 14 day period subtracted by the lowest price of the same 14day period.
The second component:
Line % D,this is an important line because it gives trading signal and works with line % K, when % K crosses above % D line it shows buy signal but when it crosses below it shows sell signal,this mostly is the reason why % D line is a slow moving average which is drawn discontinuously as %k line crosses above and below.
Formula:
% D line = 3 period moving average of % k line
% D line = highest price of 3 period of trading divided by the lowest price traded in the same period of 3.
Overbought/Oversold
Overbought or overvalued: this is when stochastic oscillator indicator reads above 80 it is considered to be overbought.
While when the indicator falls below the range of 30 and it is a bullish sign,thats is a sign of oversold or undervalued.
Briefly describe at least 2 ways to use the Stochastic Oscillator in a trade.
It is used to dictate trend reversal and this happens whenever the indicator changes direction leaving both the overbought and oversold areas pointing to reversal corner.
It is used to dictate trade signals especially with the % K line and % D line with the crossing over above and below we can know when the price is successively high or low.
Define in your own words what is Parabolic Sar?
Parabolic sar which is also called P.SAR is also a technical indicator developed by J.Welles Wilder.
This indicator is similar to moving average but has a little difference, it is used to dictate change in both bullish and bearish trend, and shows stimulation of price in a particular period of time.
In a complete sentence SAR means Stop and reverse.
Parabolic sar is used to find out the end of a current trade given traders more opportunities to know when the next trend movement starts.
I mentioned earlier that there is a bit difference between moving average and P.SAR, let me highlight a bit on that.
- P.Sar is faster than moving average.
- P.Sar shows changes in uptrend and subtrend.
But in all P.SAR when combined with other indicators works very well tho depending on the handle.
Explain in detail what the price must do for the Parabolic Sar to change from bullish to bearish direction and vice versa.
In bullish trend the small dots which are also known as parabolic lines will be place above the price which shows change of price then it will be called bearish trend.
Same in bearish to bullish direction the small dots much be below the price then it can be said to be heading to bullish direction.
Briefly describe at least 2 ways to use Parabolic Sar in a trade?
Parabolic sar is used to dictate price direction in both bullish and bearish direction
The parabolic lines or small dots helps the trader to know when to trade and when to stop.
It helps to dictate when reversal is by the
corner.
shows a step by step on how to add the Stochastic Oscillator to the chart (Indicating the% k Line and the% D Line, the overbought and oversold zone.
Step 1:
I went to my trading view app

Step 2:
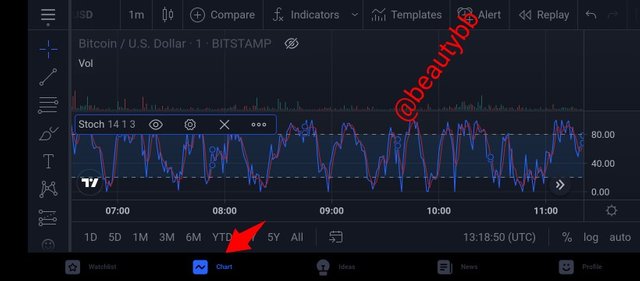
I open it,then clicked on the chart of graphic icon.
Step 3:
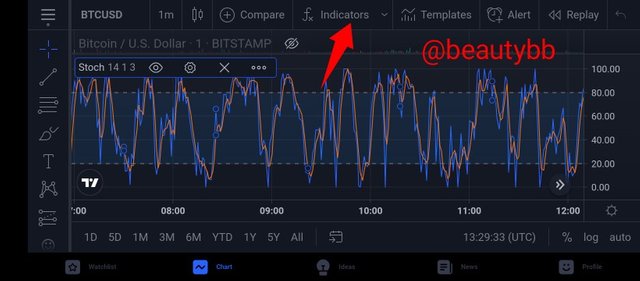
Click on the indicator icon that is located on the upper middle of the chart.
Step 4:
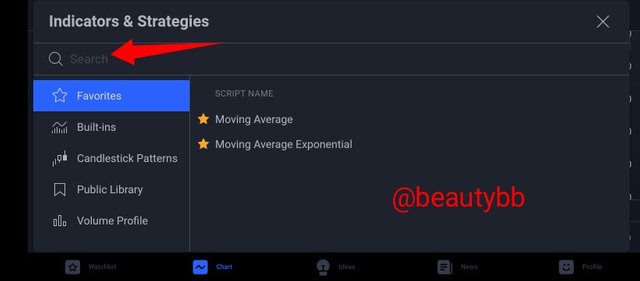
Go to the search section and search for stochastic
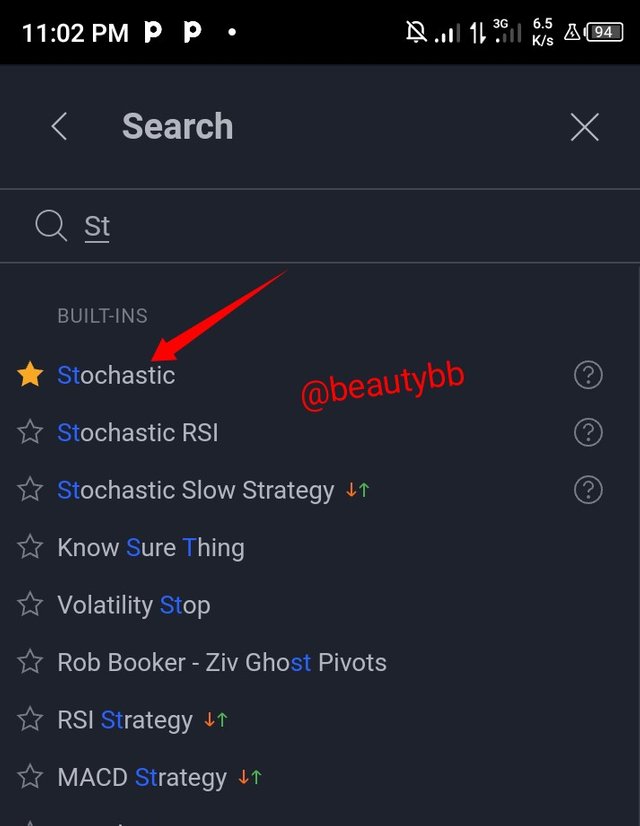
Step 5:
Add it to the chart
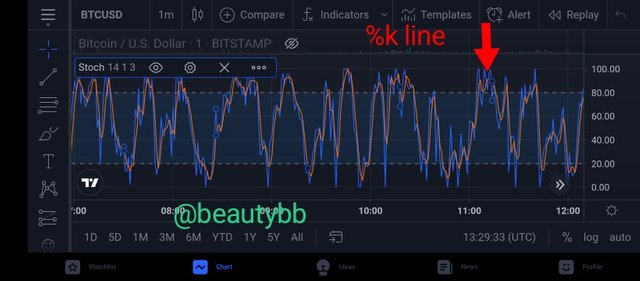

The %k line is the blue line, while the %D line is the brownish line.
Lets fish out the overbought and oversold
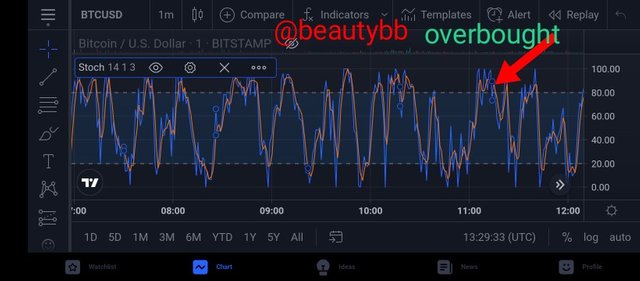
The overbought line is above 80.
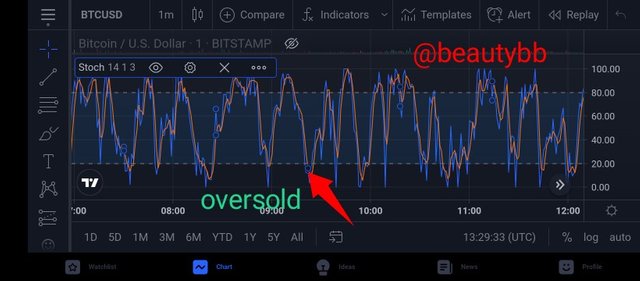
While the oversold is below 20.
Show step by step how to add Parabolic Sar to the chart and how it looks in an uptrend and in a downtrend.
In a similar steps, in my trading view chart i will click the indicator icon and use the search icon to search for parabolic sar

Then step 2 i will add it to my chart
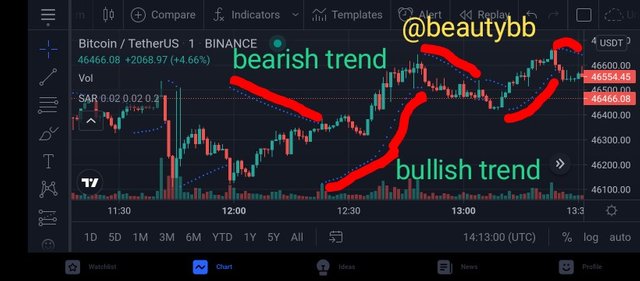
The parabolic lines or small dots are below the price, they are indicated by the blue cross path is for bullish trend.
While the small blue dots above the price shows the bearish trend.
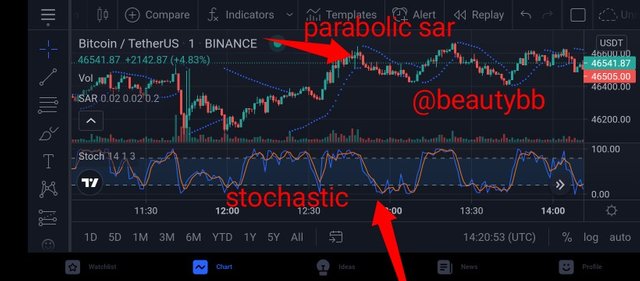
Add the two indicators (Stochastic Oscillator + Parabolic Sar) and simulate a trade in the same trading view, on how a trade would be taken.
In the below image i added the two indicators
Conclusion
Today's lecture was awesome,because am gradually getting to know how to trade,the indicators, there functions and how to use them tho still have some areas am yet to understand.
In todays lesson i have learned what is stochastic oscillator, and parabolic sar,i have learned how to apply them on my trading view chart.and also how those indicators helps traders to know when to trade and when to stop.
Thank you @lenonmc21