Crypto Academy Season 3 | Intermediate Course: Crypto Assets and the Random Index (KDJ) from@asaj submitted by @beautybb18/8/21
Homework (S03 • W08)
In your own words define the random index and explain how it is calculated
Is the random index reliable? Explain
How is the random index added to a chart and what are the recommended parameters? (Screenshot required)
Differences between KDJ, ADX, and ATR
Use the signals of the random index to buy and sell any two cryptocurrencies. (Screenshot required)
My Entry
In your own words define the random index and explain how it is calculated
Random index which is also known as KDJ is a technical indicator that helps investors and traders dictate price movement, to know when price changes, and also to dictate trend reversal, and entry point.
More to that KDJ indicator is stimulated by stochastic oscillator but KDJ has an additional line called J Line, on stochastic indicator the %k line and %D line shows the overbought an oversold with a range of 80- 20, when it ranges above 80 is overbought, and when is below 20 is oversold.
Therefore the additional J line on KDJ indicator indicates the divergence and convergence of the J line value from the k line,with the range of 0-100.
Lets see how KDJ is calculated:
First i will calculate the RSV (Reserved value)
Of a period of time RSV ranges from 0-100.
Then i will calculate the k and D value.
Lets see the formula:
N day RSV= (CN-LN)+(HN-LN)×100
CN means closing price of a period.
LN means lowest price of a period
HN means highest price of a period
Then lets calculate K and D value
K value =2/3 ×previous day of k value × reserved value.
Then D value = 2/3 ×previous D value+1/3 × k value, in some cases there is no previous day so we can use 50.
Conclusively we can say
J value - 3 ×day value of k- 2× day value of D
Is the random index reliable? Explain
I will say No, because changes of price stock has made it impossible for any indicator to provide 100% accurate signal of stock.
But on the case of Random index indicator , it is suitable for short term trading and to get a better result we can assist KDJ indicator with other indicators like Average directional index(ADX) and Average true index (ATR).
How is the random index added to a chart and what are the recommended parameters? (Screenshot required)
step 1:
I opened my trading view app

step 2
I clicked on their chart icon
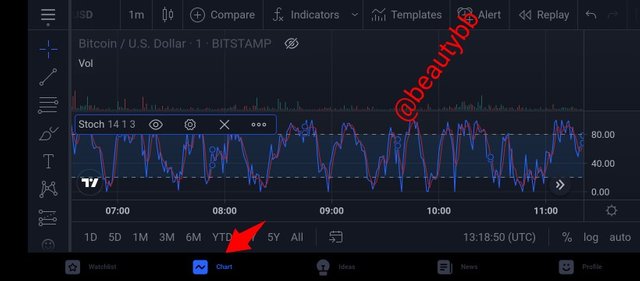
step 3
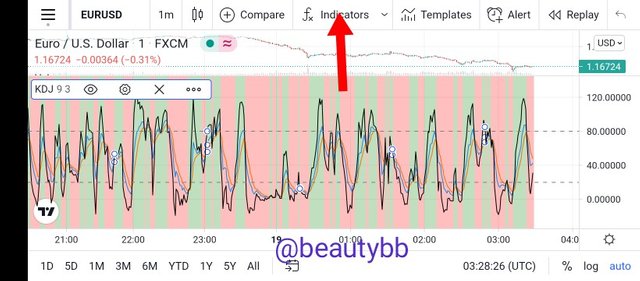
I clicked the indicator icon at the middle top.
step 3
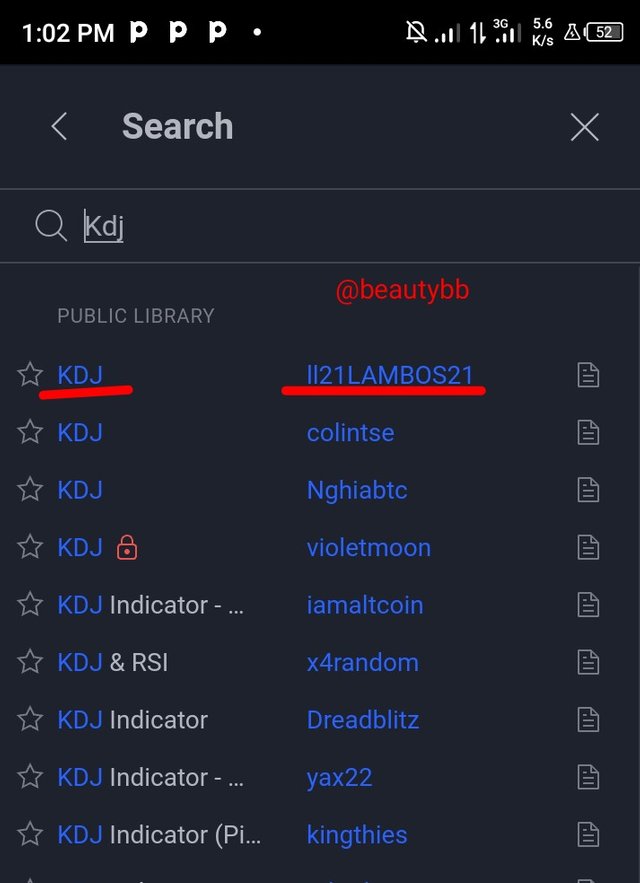
I go to the search section and added kDJ
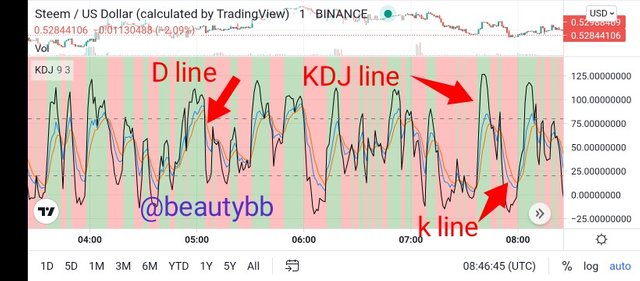
Then after adding it,from the image below;
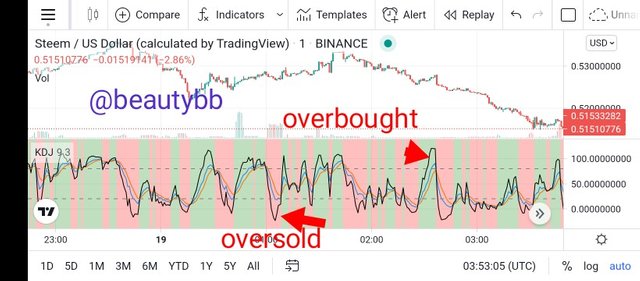
K line is the blue line.
D line is the red line
While J line is the black line.
Overbought and oversold
When the black line crosses over 80 is overbought and it indicates reversal in price stock,but when the J line crosses below 20 it is known as oversold as we can is in the image below
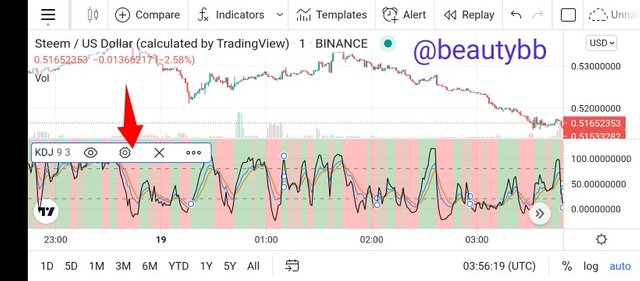
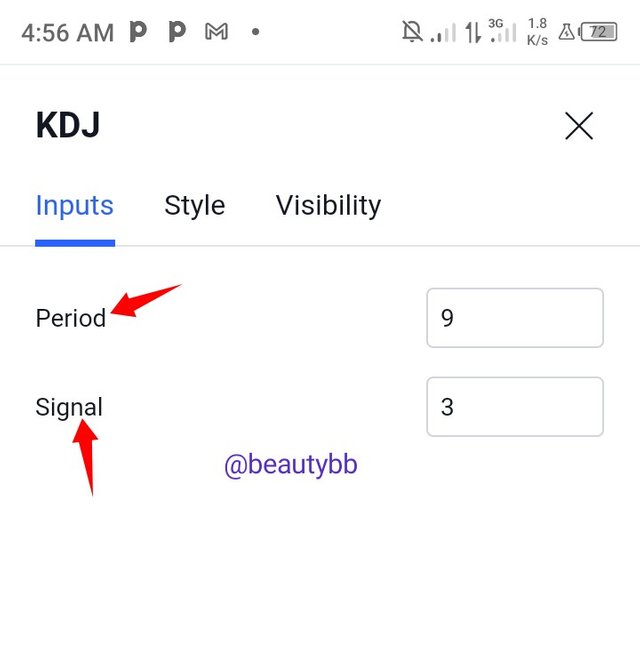
When we also go to the setting icon we have the input 9 for period and 3 for signal.
Differences between KDJ, ADX, and ATR
ADJ indicator indicates over bought and oversold, it shows trend reversal, it gives good market entry and exit.
ADX / Average directional index is a trend strength indicator and its benefits traders in dictating how strong a trend it,it ranges from 0-50 and its calculated in 14days period.
But it doesn't provide sell or buy signal,because it doesn't show trend movement.
- ATR/ Average true range is a volatile indicator that is used to place stop loss order because it moves as price moves,and its calculated on daily basis as each period passes.
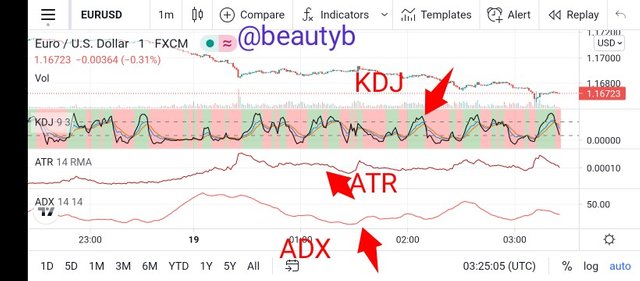
From the above image we can see that ATR and ADX has one line, but KDJ has three lines.
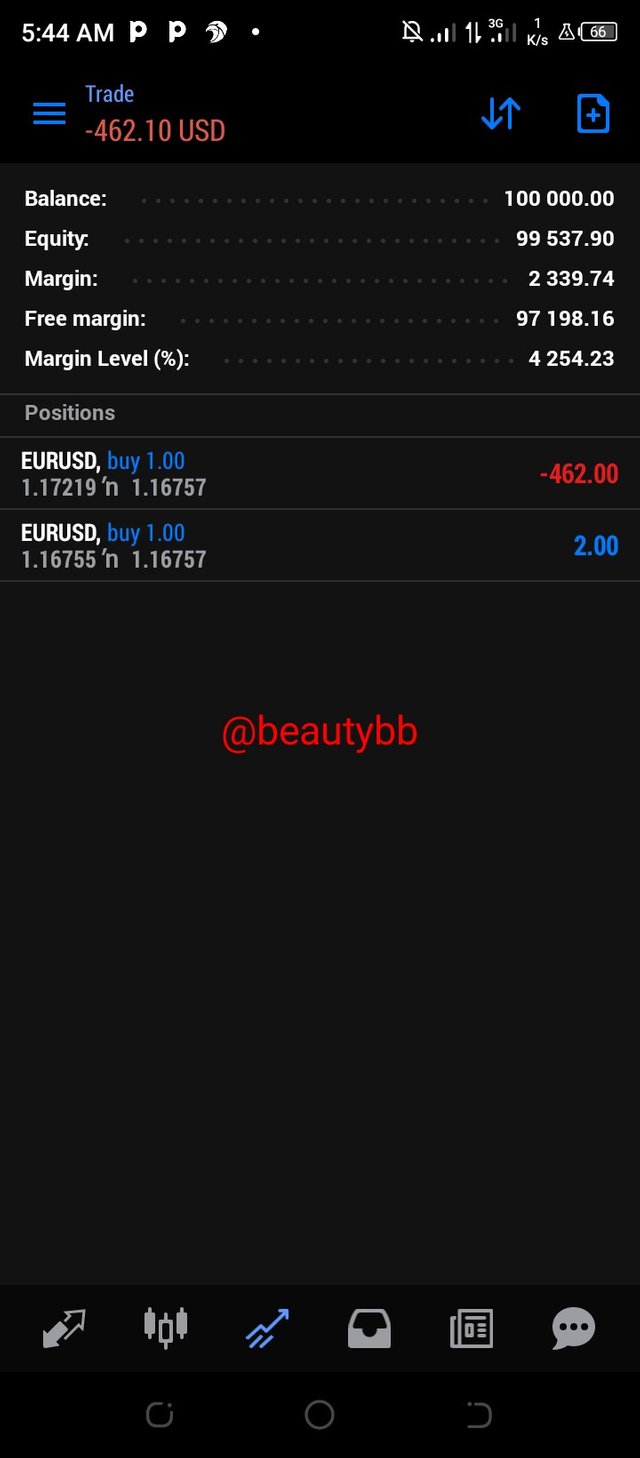
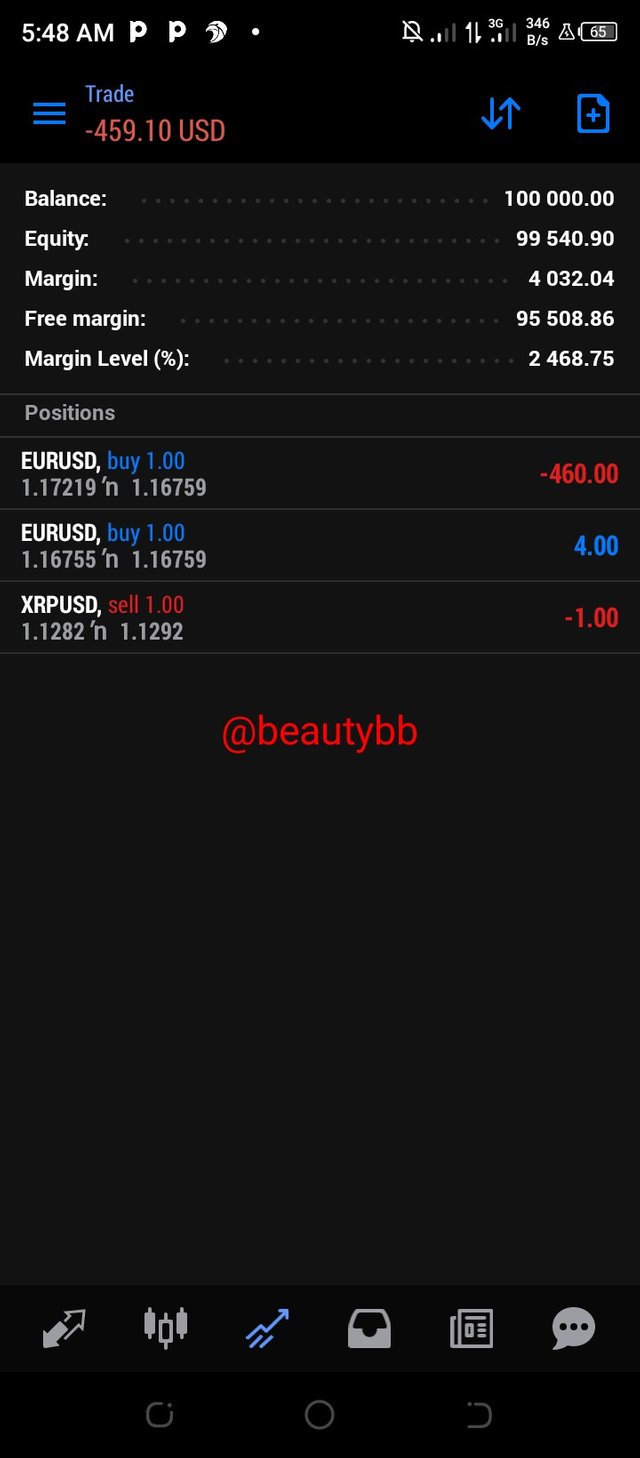
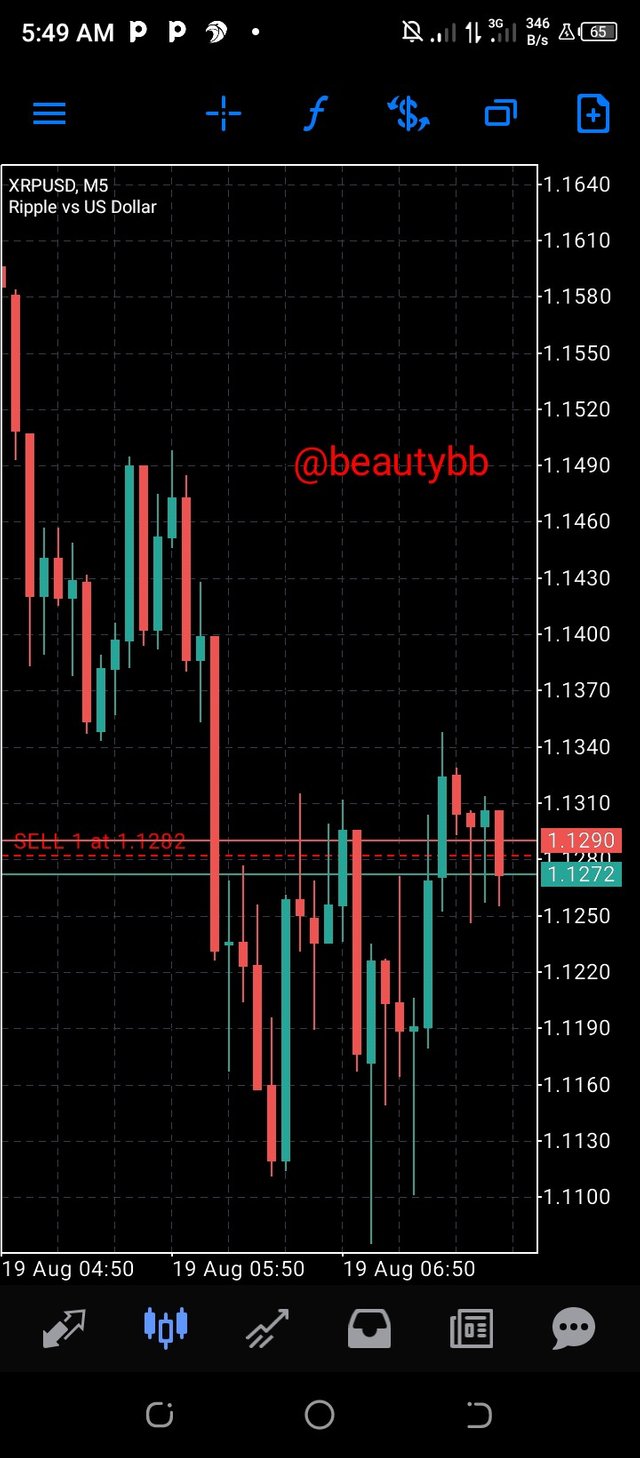
Use the signals of the random index to buy and sell any two cryptocurrencies. (Screenshot required)
conclusion
I appreciate proff @asaj so much for this lecture, today i have come to understand what KDJ is all about, more to that i also understood the difference between KDJ, ADX, ATR, i also learned how to add the three indicators to my tradeview chart.
But i still have more work to do in learning how to do a perfect demo trading.
Thank you professor @asaj.