Crypto Academy / S4W2- Homework Post for @reminiscence01". submitted by @beautybb 17/9/21
Questions
1a) In your own words, explain Technical indicators and why it is a good technical analysis tool.
b) Are technical indicators good for cryptocurrency analysis? Explain your answer.
c) Illustrate how to add indicators on the chart and also how to configure them. (Screenshot needed).
2a) Explain the different categories of Technical indicators and give an example of each category. Also, show the indicators used as an example on your chart. (Screenshot needed).
b) Briefly explain the reason why indicators are not advisable to be used as a standalone tool for technical analysis.
c) Explain how an investor can increase the success rate of a technical indicator signal.
My Answers
1a) In your own words, explain Technical indicators and why it is a good technical analysis tool
Technical indicators are graphical signs produced by price and volume of an asset, and it is used to dictate price movement,strength of an asset, overbought and oversold, support and resistance and many more.
This indicators can be created with closing opening price of an asset, it can be used to dictate future analysis of an asset, and it has different categories and different functions.
Technical indicators are good technical analysis because it helps to make profit when used well by traders, since prices of crypto-asset can never be steady indicators helps to know the direction of market price and the strength.
1b) Are technical indicators good for cryptocurrency analysis? Explain your answer.
I will say yes technical indicators are good for cryptocurrency analysis because it helps to understand market conditions,to know if the market is trending or ranging and with this traders can make a good decision.
1c)Illustrate how to add indicators on the chart and also how to configure them. (Screenshot needed).
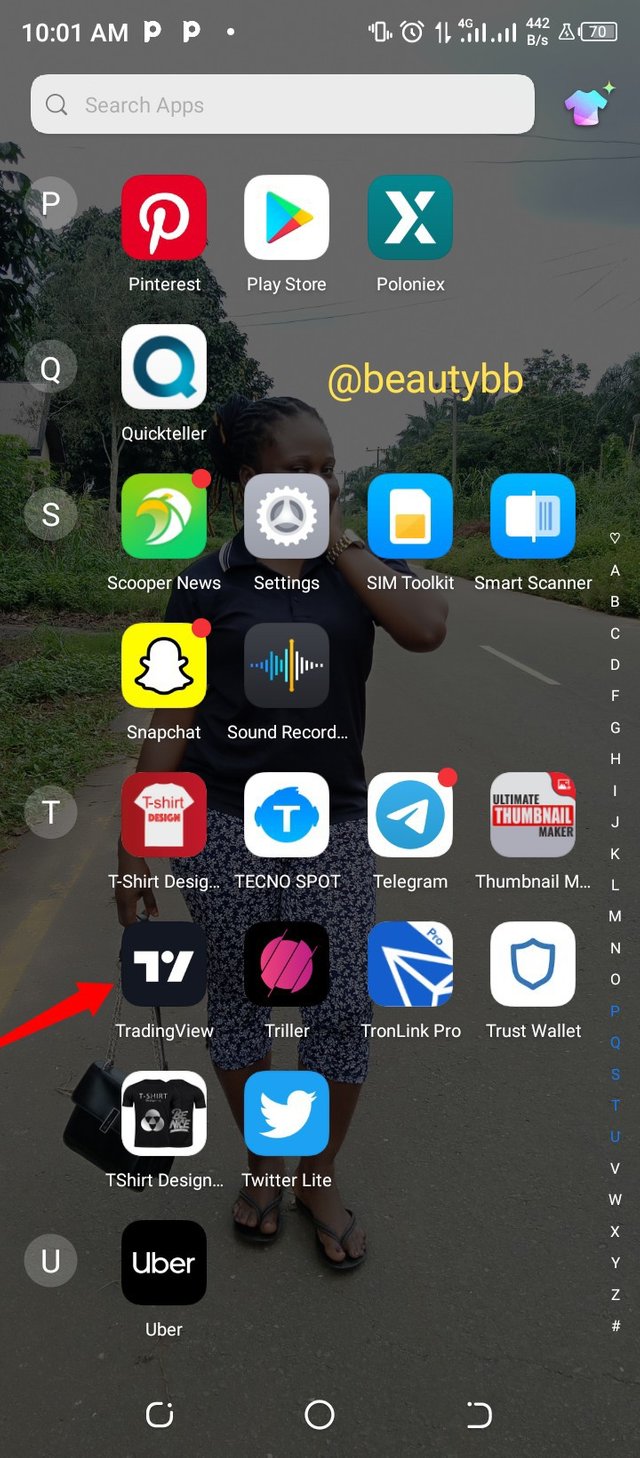
Step 1:
Open my trading view app
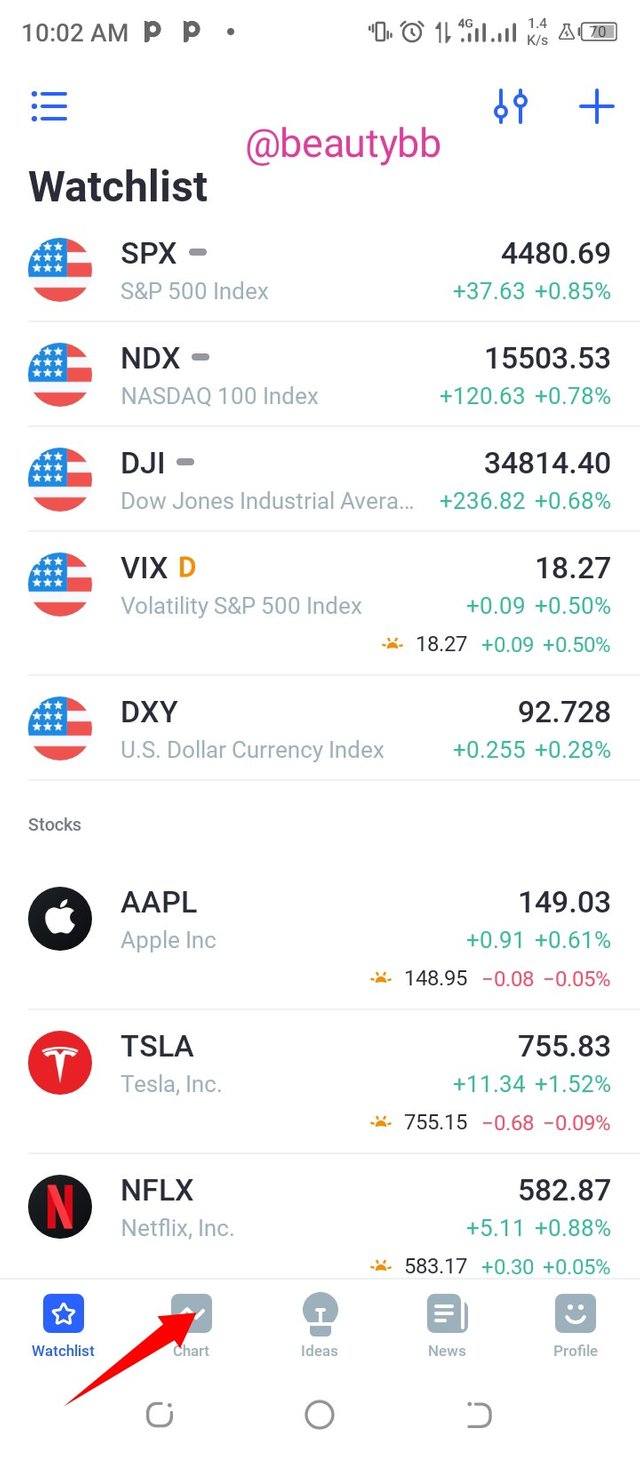
Step 2:
Click the indicator icon on the top of the chart
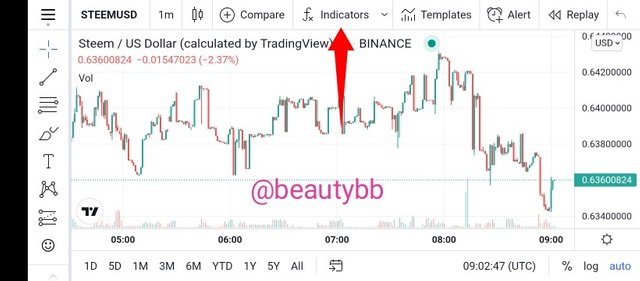
Then it opens
Once you click the search icon and type you will see different types of indicators, then you click the one you want to add to your chart.
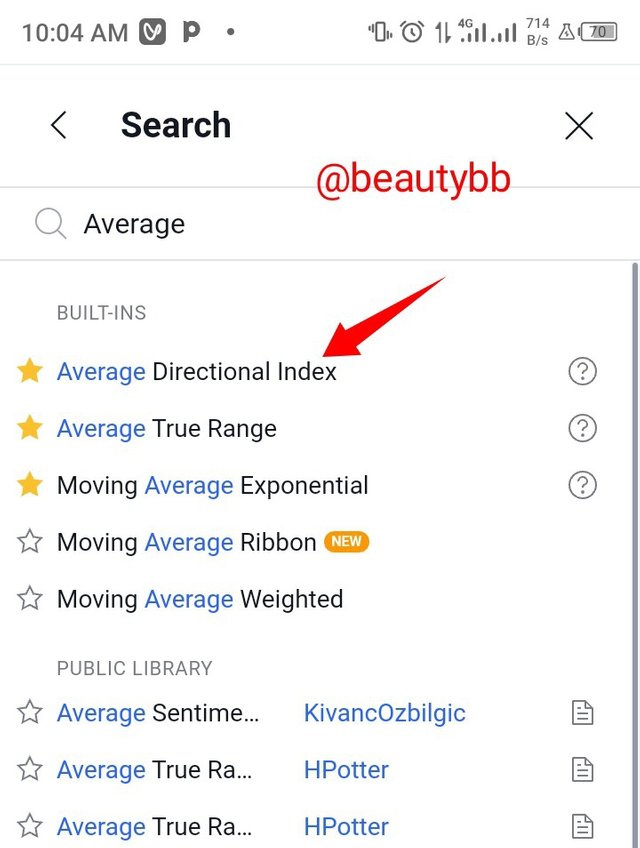
Am adding Average Directional index(ADX) then i click it
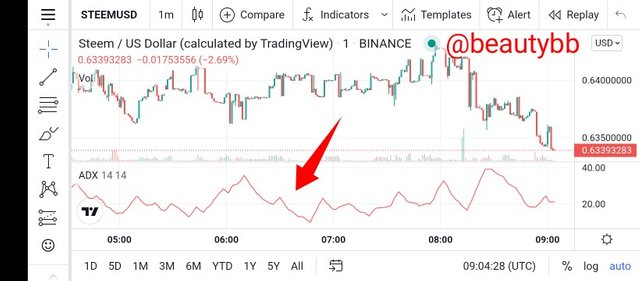 i have successfully added ADX indicator in my STEEM/US DOLLAR chart.
Then lets go to configure our indicator by clicking the setting icon as my below image shows
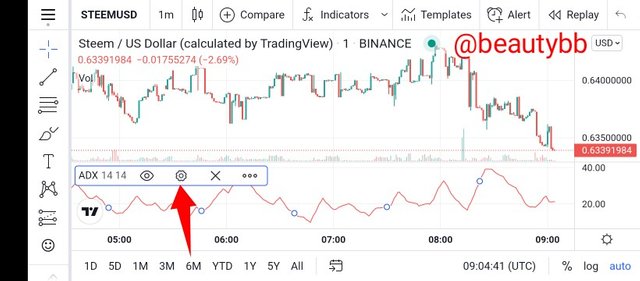
Then we can be able to change it to any length and color of our choice of trade.
Change and click ok
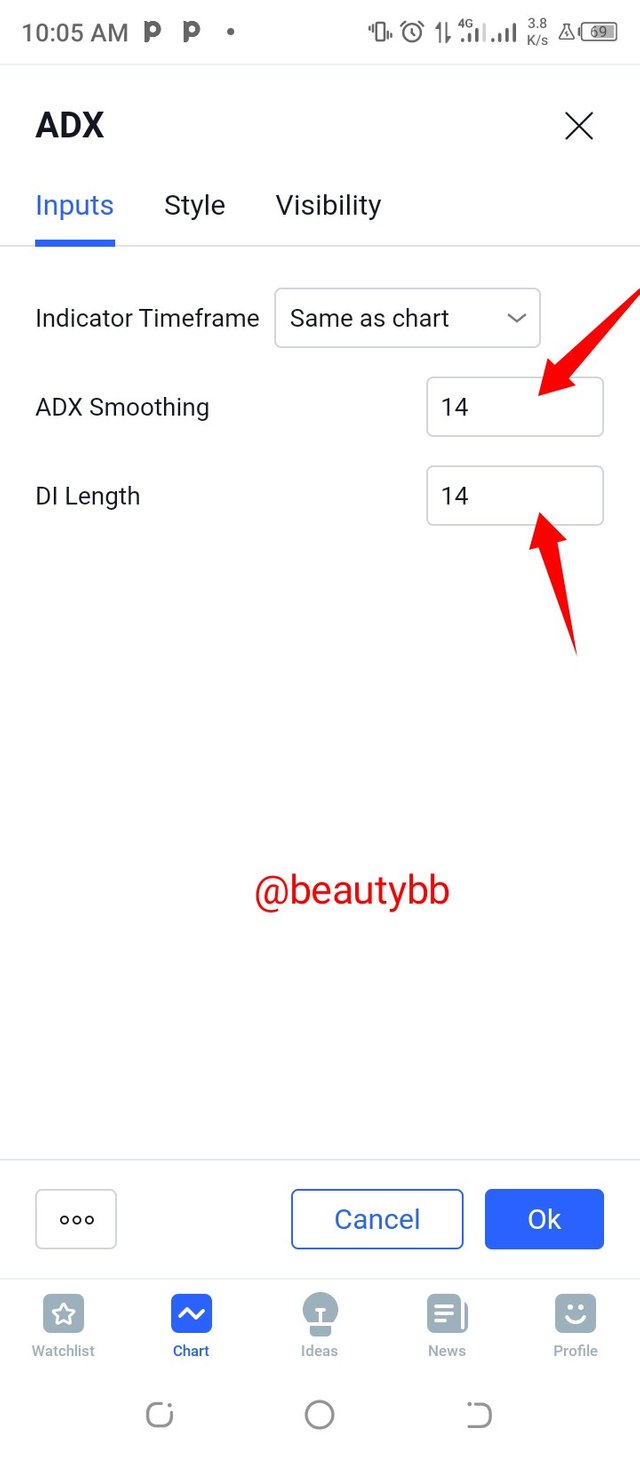
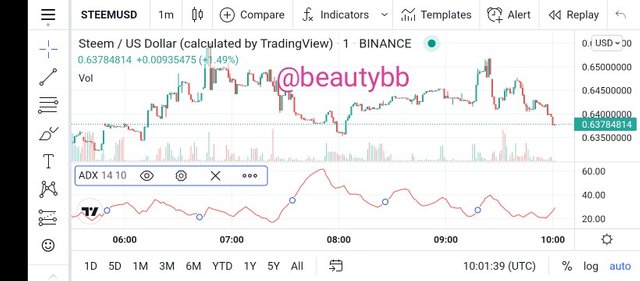
I have successfully configured the ADX indicator
2a) Explain the different categories of Technical indicators and give an example of each category. Also, show the indicators used as an example on your chart. (Screenshot needed).
There are three categories of indicators:
- Trend-based indicator.
- Momentum-based indicators.
- Volatility indicators.
Let me discussion them one after the other.
Trend-based indicators;
Trend-based indicators helps traders to know current market trend,to know price direction of crypto-asset, it also helps to dictate the strength and weaknesses of a trend, examples of trend-based indicators are;
- Moving Average(simple moving average or exponential moving average)
- Average Directional Index (ADX)
- Ichimoko kinko Hyo
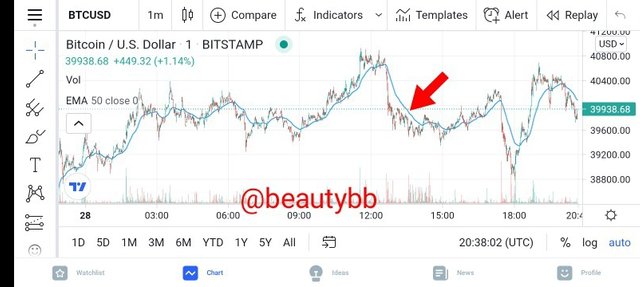
Exponential moving average indicator is used to see average price of a trend in a specific period of 50-200 days, and it is based on recent price of an asset, below is my crypto chart in which i added EMA indicator to my chart,
Momentum-Based indicators;
This is also known as Oscillator and this indicator is used to dictate the speed and the strength of a crypto-asset, it helps to know the overbought and over sold of a stock,and with this indicators trader will no when to trade and make profit.
Examples of momentum-based indicators are;
- Relative strength index (RSI)
- Moving average convergence divergence (MACD)
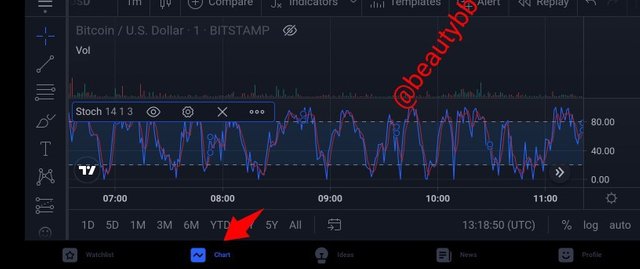
- Stochastic.
Stochastic indicators predicts trend reversal, it shows overbought and oversold levels of and assist below is my crypto chart where i add stochastic indicators
Volatility indicators;
Volatility based indicators are used in measuring upswings and down swings of the market,traders with this indicator knows when to buy at low price to make profit.
Examples of volatility-based indicators are;
- Bollinger Band which has upper, middle,lower bands.
- Average True Range(ATR)
- India VIX.
- Keltner channel that is placed on any side of the stock price to know its trend direction.
Below is my chart where i add Average True Range indicator.
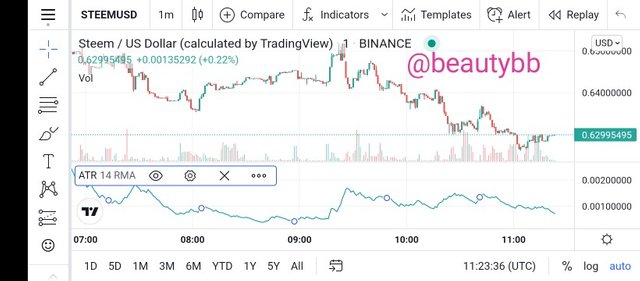
Average True Range indicator:STEEM/US DOLLAR CHART
2b) Briefly explain the reason why indicators are not advisable to be used as a standalone tool for technical analysis
It is not advisable because no one indicator can give 100% accurate signals in a price movement of a chart, because price can either increase or reduce after entry,a single indicator can give false signal when used alone or lag behind market price,based on this it is advisable that a trader combines more than one indicator, and study them well before using them to trade.
Explain how an investor can increase the success rate of a technical indicator signal.
An investor can be successful in using technical indicators by studying his indicators very well, knowing the appropriate time to trade,and when not to trade.
He should also know the importance of each indicator,how to use them to dictate support and resistance.
He needs to know how to use indicators in confirming prices action and signals to avoid fakeouts in the market
For example if he is using Relative Strength Index (RSI) he should be able to use this indicator to dictate overbought and oversold signal.
An investors should be able to use indicators to dictate the condition of the market,if the market is trending or ranging, especially when it comes to trend-based indicators.
Finally an investor that wants to be successful should never depend on one indicator, he should make sure he verifies any signal because execution, with this he can be successful in using technical indicators.
Conclusion
Technical indicators are very beneficial when used properly, but when not well checked can lead to loss.
Technical indicators is very good is tracking and monitoring trade
Thank you proff @reminiscence01
Hello @beautybb, I’m glad you participated in the 2nd week Season 4 of the Beginner’s class at the Steemit Crypto Academy. Your grades in this task are as follows:
Observations:
That's correct.
Recommendation / Feedback:
Thank you for submitting your homework task.
Thank you proff, i promise to improve more,@reminiscence01
Please @steemcurator02 my task is yet to be curated, i will appreciate if it will be given attention, thank you so much.