Steemit Crypto Academy Season3 week2- Beginner's course| Introduction to Charts by @reminiscence01
Hello friends,
Special thanks to @reminiscence01 for the simple and straight-forward lecture. I loved the way you explained everything using simple terms. I also loved your choice of words. Kudos.
Explain the Japanese Candlestick Chart? (Chart screenshot required)
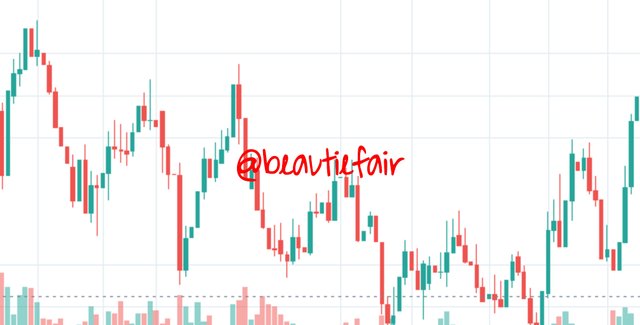
Japanese candlestick chart
People who trade, make use of Japanese Candlesticks as a technical analysis tool to chart and evaluate stock price movements.
ORIGIN
The Japanese candlestick chart has a long history, Candlestick charting was invented by Munehisa Homma, a Japanese rice seller.
Homma discovered that the rice market was influenced by traders' emotions during everyday trading, while still recognising the impact of demand and supply on rice prices.
Homma created candlesticks that graphically indicated the nature of price swings by denoting differences with distinct colors. Traders can use candlesticks to discover price action patterns and make judgments based on the price's short-term direction.
The way it works
Japanese Candlesticks provide more detailed and precise price movement information.
They show the supply and demand that drives price action over time in a graphical format.
Each candlestick has a center part, referred to as the body, that displays the distance between the open and close of the securities being traded. The price difference between the top of the body and the high for the trading session called the upper shadow. The lower shadow represents the price difference between the bottom of the body and the trading period's low.
Whether a candlestick is bullish or bearish is determined by the closing price of the security being traded. If the candlestick closes at a higher price than it opened, the real body is usually white. The closing price is at the top of the true body in this case, whereas the opening price is at the bottom.
The body is usually filled up or black in color if the security being traded closed at a lower price than it opened for the time period. The opening price is at the top of the body, while the closing price is at the bottom.
Modern candlesticks now come in a variety of colors, including red, green, and blue, to replace the white and black of the body. When using computerized trading systems, traders can choose from a variety of hues.
Describe any other two types of charts? (Screenshot required)
Line chart
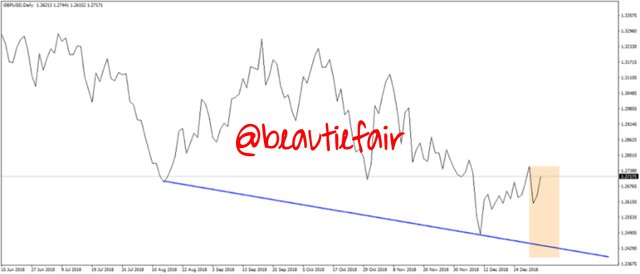
This graph is straightforward and uncomplicated. It is frequently used to track long-term changes in asset market values. Prices for specified time periods are included. Line charts are used to identify and link the closing prices of specific periods in order to develop trends during those periods.
Bar chart
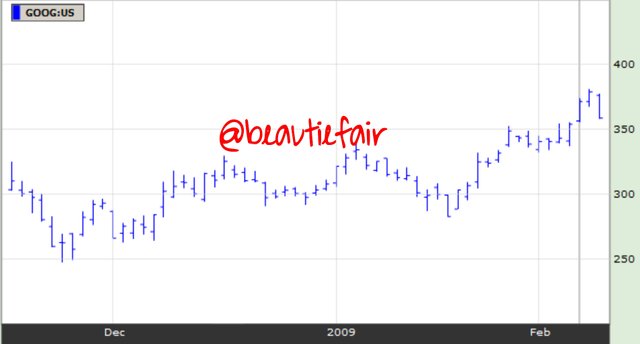
Bar charts are made up of many price bars, each of which depicts how the price of an asset or security changed over time. Each bar usually displays the open, high, low, and closing (OHLC) prices, though this can be changed to display only the high, low, and close prices (HLC).
Bar charts are used by technical analysts to track price action and aid in trading decisions. Traders can use bar charts to study trends, anticipate probable trend reversals, and track volatility and price fluctuations.
In your own words, explain why the Japanese Candlestick chart is mostly used by traders.
• It gives a pretty clear indication of the market's direction. The shape of the candles, as well as the color of the candles, have a significant part in this.
• The candlestick pattern can be used to swiftly determine the market's trend and pattern. It's easy to tell whether the bulls or the bear are taking over.
• With just a glance, it reveals the current situation of the market. Colors play an important role in making this process go well.
• The past trend of a candlestick pattern can be used to predict the future move.
Describe a bullish candle and a bearish candle identifying its anatomy? (Screenshot is required)
A candle is made up of four major components:
Opening price: The asset's trading price at the start of the time interval in question.
The highest trading price: The asset's highest trading price recorded during the time span in question.
The minimum price: During the interval, the asset's lowest trading price was recorded.
Closing price: This is the asset's last trading price during the chosen time interval.
The color of a candle is the most important part about it. It assesses if a security's opening price was higher or lower than its closing price.
.png)
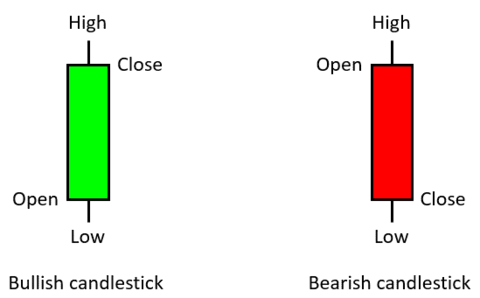
Bullish
All of the characteristics of a candlestick are present in a bullish candle, including the high, low, actual body, open, close, upper shadow, and lower shadow. It also opens below and closes above the real body, indicating that price is rising upstream. A bullish candle is one in which the opening price is lower than the closing price, and the candle is green in color. For a bullish candle, the opening price is represented at the bottom of the candle body, whereas for a bearish candle, the closing price is shown at the top of the candle body.
Bearish
The color red denotes a bearish candle. The initial price is greater than the closing price in a bearish candle. Because a bearish candle represents a price decline, the top of the body represents the initial price and the bottom represents the closing price.
CONCLUSION
Since its creation, the Japanese candlestick chart has grown in popularity and has been widely accepted. It is critical for traders who work with cryptocurrencies to read the charts. By carefully studying and investigating the assets with charts, traders must have a comprehensive grasp of the price fluctuation of digital assets.
cc;
@reminiscence01
Hello @beautiefair , I’m glad you participated in the 2nd week of the Beginner’s class at the Steemit Crypto Academy. Your grades in this task are as follows:
Observations:
That's correct. The closing price of a candlestick is the sensitivity to traders. Traders use this information to determine the struggle between buyers and seller and also to determine who is in control of price.
Not really. Colors is just to differentiate the bullish candle and the bearish candle. What matters most is the closing price of the candle. That's reveal enough information on the asset.
Recommendation / Feedback:
I'm impressed with the research you carried out to produce this content. Keep the good work up.
Thank you very much prof @reminiscence01