Steemit Crypto Academy season 3 week 4 -Beginners course|Candlestick patterns @reminiscence01
Hello friends,
It is a new week. New week comes with new lectures and new task. Special thanks to @reminiscence01 for the wonderful lecture. I always love your simplicity. Kudos. Below is my homework.
INTRODUCTION
Technical analysts believe that the price reflects all available information about the stock, making it efficient. Nonetheless, historical price performance has little bearing on future price performance, and a stock's current price may have nothing to do with its real or underlying value. As a result, technical analysts employ tools to sift through the noise in order to uncover the best bets. Honma, a Japanese rice dealer, invented one of these tools. - The chart of candlesticks.
There are four types of data that assist establish the shape of a candlestick pattern. Analysts can draw inferences about price behavior based on this structure. Every candlestick has an open, a high, a low, and a close. There is no difference with what time or period or tick interval that is used.
The candlestick pattern's body is the filled or hollow bar it produces. Shadows are defined as lines that extend from the body. A hollow candlestick indicates a stock that closes higher than it opened. The body will have a filled candlestick if the stock closes lower.
In your own words, explain the psychology behind the formation of the following candlestick patterns.
Bullish engulfing Candlestick pattern
Doji Candlestick pattern
The Hammer candlestick pattern
The morning and evening Star candlestick pattern.
Bullish engulfing candlestick pattern
The bullish engulfing pattern is a two-candle reversal pattern. Regardless of the length of the tail shadows, the second candle totally ‘engulfs' the genuine body of the first.
This pattern is made up of one dark candle and a larger hollow candle that appears in a downtrend. The price begins lower than the previous low on the second day of the pattern, but buying pressure pushes it higher than the previous high, resulting in a clear win for the buyers.
The stock must open at a lower price on Day 2 than it closed at on Day 1 to form a bullish engulfing pattern. The body of the white candlestick would not have had a chance to swallow the body of the previous day's black candlestick if the price did not gap down.
Because the stock opens lower than it ended on Day 1 and finishes higher than it opened on Day 1, the white candlestick in a bullish engulfing pattern depicts the period or time when bears controlled the company's price in the morning before bulls decisively took control by the end of the day.
A small upper wick on a white bullish engulfing candlestick indicates that the stock closed at or around its greatest price, implying that the day ended while the price was still soaring upward.
Because there is no upper wick, the next day is more likely to generate another white candlestick that closes higher than the bullish engulfing pattern closed, yet it's also possible that the next day will create a black candlestick after gapping up at the opening. Analysts pay particular attention to bullish engulfing patterns since they tend to indicate trend reversals.
DoJi Candlestick Pattern
"doji" is a term for a trading session in which the open and close of a security's candlestick are almost equal, and are frequently used in patterns. Doji candlesticks have the shape of a cross, an inverted cross, or a plus sign. It usually has a neutral tone to it.
When a stock's open and close are nearly identical, it forms a doji, which can be either singular or plural. Doji have little or nonexistent bodies and resemble a cross or plus sign.
Doji signify indecision on both the buyer's and seller's sides, according to auction theory. Because everyone is on an equal footing, the price is frozen; buyers and sellers are at odds.
This has been interpreted by some observers as a hint of a turning point. It could, however, be a time when buyers or sellers are amassing momentum in anticipation of a trend continuance. Doji are frequently seen during periods of consolidation and can aid analysts in spotting possible price breakouts.
The Hammer candlestick pattern
After a security has been decreasing, a hammer appears, indicating that the market is attempting to find a bottom.
The shape of a hammer should resemble a "T." Until a price reversal to the upside is established, a hammer candlestick does not signify a price reversal.
If the candle after the hammer closes above the hammer's closing price, it is considered confirmation. This confirmation candle should ideally show a lot of buying power.
During or after the confirmation candle, candlestick traders will often aim to add long positions or exit short positions. A stop loss can be placed below the low of the hammer's shadow for individuals entering new long positions.
Even with confirmation, hammers are rarely used alone. Traders often use price or trend analysis, as well as technical indicators, to corroborate candlestick patterns.
Hammers signify a potential capitulation by sellers in order to establish a bottom, which is accompanied by a price rise, indicating a possible price reversal. This occurs all at once, with the price falling after the open but regrouping to close close to the open.
When at least three or more declining candles precede a hammer, it is most effective. A descending candle closes lower than the previous candle's close.
One-minute charts, daily charts, and weekly charts all have hammers.
The morning and Evening star candlestick pattern
At the bottom of a downtrend, the morning star is a bullish reversal pattern. It just signals a probable reversal, as do other candlestick patterns, an idea that should ideally be confirmed with additional indicators.
How to recognize the formation of morning stars.
• Since a morning star is a bullish reversal pattern, there must be a downtrend in place.
• The first candle should be a bearish candle with a longer tail.
• As the bulls and bears start to level out during the course of the session, the second candle should be undecided.
• The third candle should be a powerful bullish candle, implying that the reversal is almost complete.
The evening star, on the other hand, is a reversal pattern with the same structure as the morning star. The evening star, unlike the morning star, appears at the peak of an uptrend and indicates a possible price direction change.
The morning star structure's four requirements apply here as well. The first candle should be lengthy and bullish near the end of an uptrend, the second should be at the top and suggest indecision (green or red), and the third and final candle signals the beginning of a reversal, as the buyers no longer have control over the price action.
Identify these candlestick patterns listed in question one on any cryptocurrency pair chart and explain how price reacted after the formation. (Screenshot your own chart for this exercise)
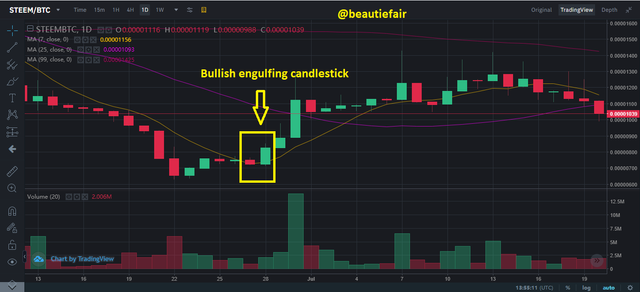
- The Bullish Engulfing candlestick of Steem|BTC is depicted in the above chart. The bullish Engulfing candlestick appears on the chart during the 27th and 28th of June.
Because the next day's starting price was 0.00000715 (lower than the previous day's ending price of 0.00000724), the above is a good example of the Bullish engulfing candlestick. There was an uptick in the price of Steem|BTC Asset following the appearance of the bullish candlestick.
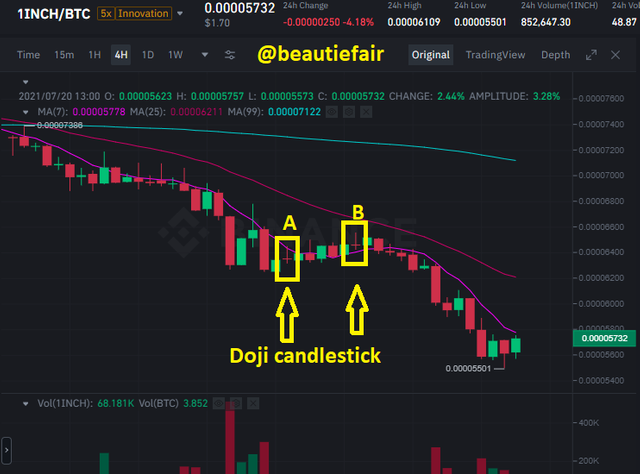
2.The appearance of two grave stones is depicted in the 1INCH|BTC chart above (A&B). A trend reversal was seen from point A to point B, where a negative reversal was also seen.
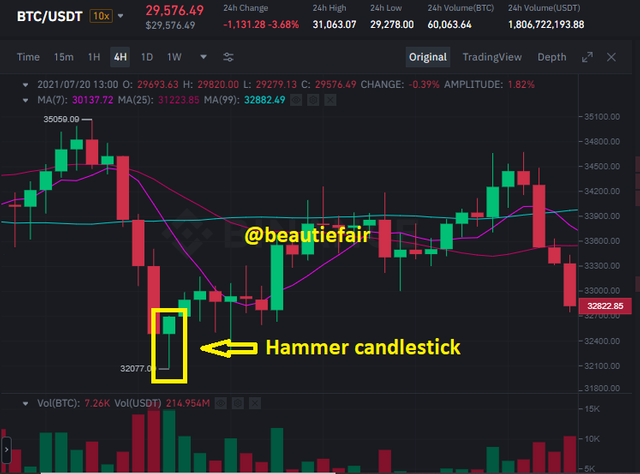
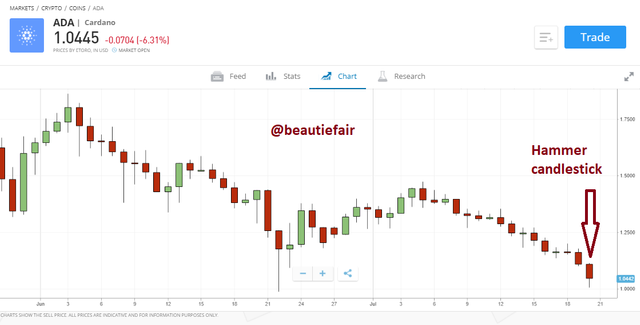
3.The Hammer candlestick is visible on the BTC|USDT chart. There was a Bullish/ upward price movement of the Asset when the Hammer candlestick appeared.
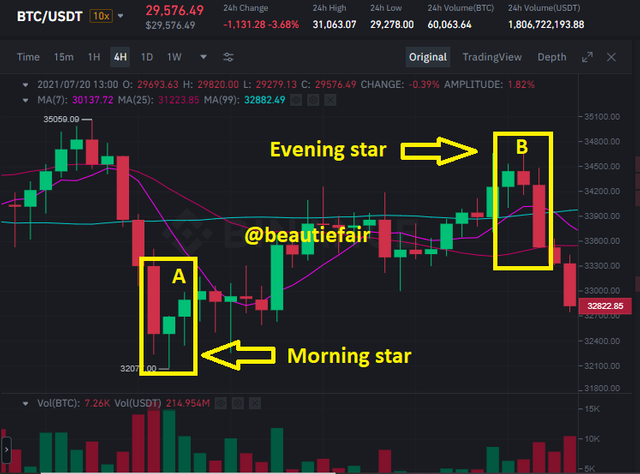
4.The morning star (A) and evening star (B) candlestick patterns can be seen on the BTC|USDT chart above. A trend reversal is frequently preceded by the appearance of a morning and evening star candlestick, as shown in A, where there was a bullish|uptrend movement and B, where there was a bearish|downtrend movement.
Using a demo account, open a trade using any of the Candlestick pattern on any cryptocurrency pair. You can use a lower timeframe for this exercise.(Screenshot your own chart for this exercise).
The above trading chart depicts ADA/USDT trading on eToro. When the Hammer candlestick appeared, trade was initiated.
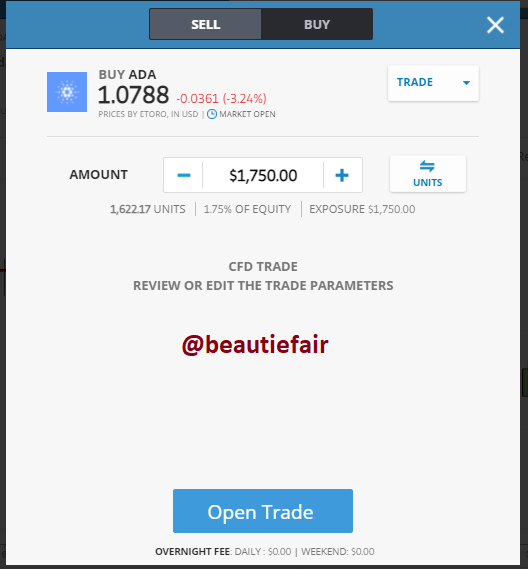
A Bullish/uptrend movement is expected with the creation of the Hammer candlestick, so the trade should be successful.
cc;
@reminiscence01
Hello @beautiefair , I’m glad you participated in the 4th Week of the Beginner’s class at the Steemit Crypto Academy. Your grades in this task are as follows:
Recommendation / Feedback:
Thank you for completing this homework task.