Steemit Crypto Academy Season 3- Dynamic Beginner Course - Week 3|All about Trends,supports and Resistances and simple chart patterns by @lenonmc21
Special thanks to @lenonmc21 for his wonderful lecture. Below is my homework task.
Define in your own words what is a Trend and Trend Lines and what is their role in charts?

What is a trend?
A trend is the overall direction in which market values or the price of an asset change. A trend can be either bullish (uptrend) or bearish (downtrend) (downtrend). A trend does not have to exist for a certain amount of time to be considered one, yet the longer one exists, the more qualified it becomes.
uptrend
An uptrend is defined as the upward movement of a financial asset's price over time. In an uptrend, each consecutive peak and dip is higher than the previous peaks and troughs. As a result, the swing lows and highs on the upswing are higher.
downtrend
A downtrend occurs when the overall direction of a financial asset's price movement is downward.
In a downtrend, each successive peak and trough is lower than those recorded earlier in the trend.
As a result, the decline is characterized by lower swing lows and highs.
Many traders trade in the same direction as the trend, while contrarians watch for reversals or trade against it. Uptrends and downtrends exist in all markets, including stocks, bonds, and futures. Trends can be detected in statistics when monthly economic data increases or decreases from month to month.
TRENDLINE
A trendline is a line drawn around pivot highs or lows to show current price movement. Support and resistance to change are represented graphically by trendlines. They show the direction and pace of price movements, as well as patterns that occur during price contractions.
Traders use trendlines on charts to connect a series of prices or to indicate the best fit of data. The resulting line is then used to provide the trader a good idea of which way the value of an investment will move in the future.
When it comes to technical analysis, trendlines or price action highlight when the price makes higher swing highs and lower swing lows for an uptrend or lower swing lows and lower swing highs for a downtrend.
ROLE OF Trend in Charts
• The trend is the first signal of price behavior for a certain item over time in a chart.
• The trend depicts the market's price movement in one direction. As a result, investors can use the trend to determine whether to purchase or sell when they read and study the trend.
• When the trend is up, it means that market participants are buying assets at a very high pace, suggesting a bullish trend, and when the trend is down, it means that market participants are buying assets at a very low rate, indicating a bearish trend.
• The trend aids investors in determining which price direction offers the least resistance.
• The trend aids market traders in investing their funds in a single direction.
ROLE OF Trend lines
• In the chart market, trend lines provide a clear glimpse of the trends.
• By evaluating the trend chart, market participants can predict when prices are high and when prices are low using trend lines.
• The trend lines created in the trend chart assist market participants in determining which way the price of an item will go next.
• Market participants can use trend lines to see the particular direction of prices on a trend chart.
• Trend lines, unlike trends, can be used to determine price activity on a chart regardless of the time frame.
Explain how to draw an uptrend line and a downtrend line ( show a screenshot of each)
How to Make downtrend
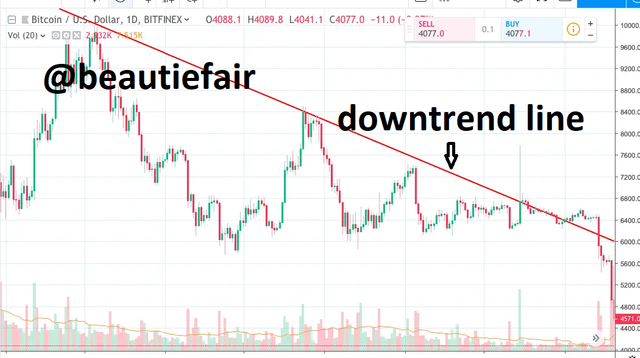
A downtrend line is constructed by joining two or more high points and its slope is negative . In order for the line to have a negative slope, the second high must be less than the first. A genuine trend line must be joined at least three times to be regarded valid.
Downtrend lines operate as resistance, indicating that even as the price falls, net supply (supply less demand) is increasing.
How to make Uptrend
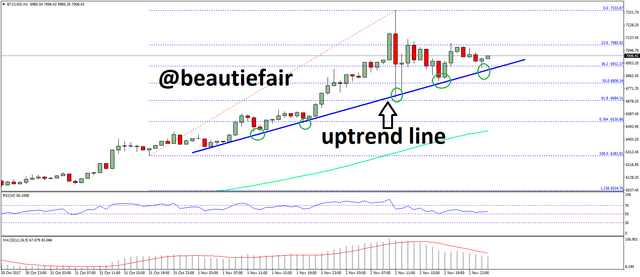
An uptrend line has a positive slope and is formed by joining two or more low points. The second low must be higher than the first if the line is to have a positive slope. It's worth noting that a genuine trend line must be linked at least three times.
Uptrend lines operate as support and signal that even when the price rises, net-demand (demand less supply) is increasing.
Define in your own words What Supports and Resistance are and how we can identify both Zones (show a screenshot of eachone)
Support
A price level at which a downturn is expected to pause due to a concentration of demand or purchasing interest is known as support. The support line is formed when the price of assets or securities falls and demand for the shares rises. In layman's words, it's a chart area with the potential for buying pressure.
Resistance
On a price chart, resistance refers to a price reversal from an uptrend to a downtrend as a result of selling interest while the asset's price is high. In layman's words, it's a chart area with possible selling pressure.
The support and resistance zones are used by traders to determine when to enter and exit a trade. When these zones are identified, it is thought that there is a chance of a bounce back or a continued creation of support and resistance along the chart.
How to Identity both Zones
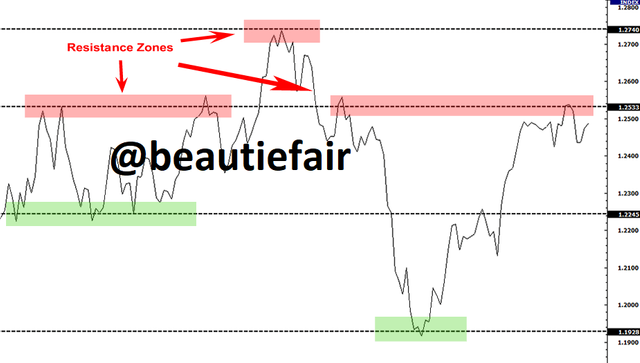
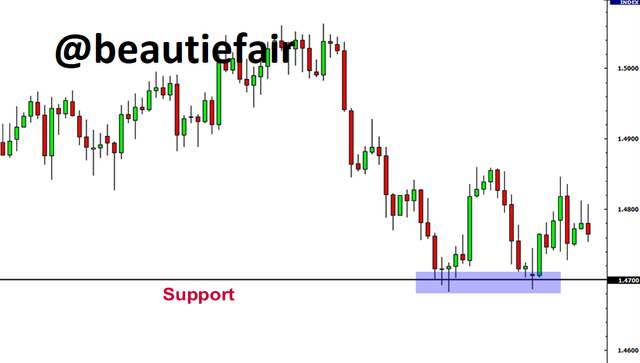
Drawing a horizontal line that cuts across strong resistance and support is one way to accomplish this. Extend the line to previous pricing actions to see if they reacted similarly.
If the line meets another level of support or resistance, it indicates that more will emerge in the future.
As a result, the number of times these levels hit the horizontal line from the past to the present determines whether they are strong support or resistance.
Explain in your own words at least 2 simple chart patterns with screenshots
Head and Shoulders
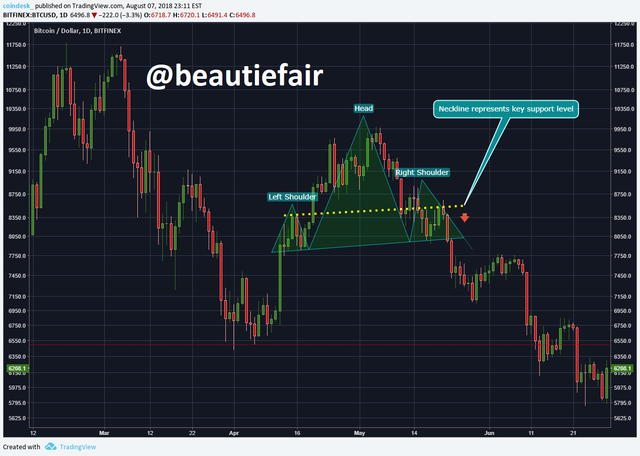
A chart pattern with a huge peak on one side and a somewhat smaller peak on the other is known as a head and shoulders pattern. .Head and shoulders patterns are employed by traders to signify a bullish-to-bearish reversal
The first and third peaks are usually smaller than the second, but they all fall back to the same level of support, known as the 'neckline.' It is expected that the third peak will break down into a bearish downtrend once it has fallen back to the level of support.
Double bottom
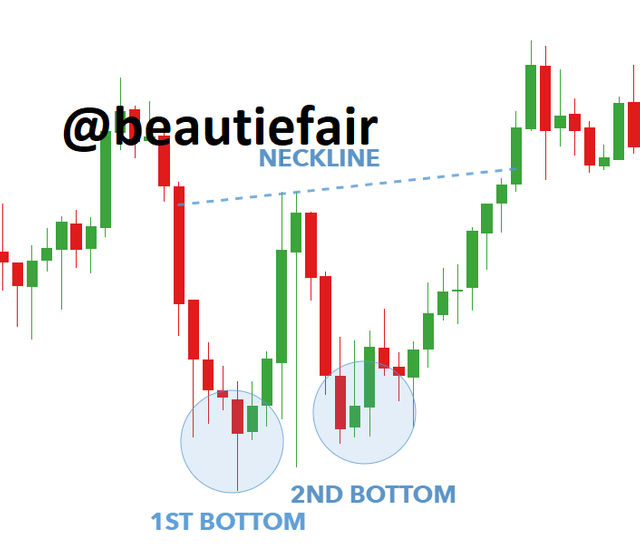
A double bottom chart pattern suggests a period of selling, with the price of an asset dropping below a support level. Then it will rise to a point of resistance before descending. Finally, when the market grows more positive, the trend will invert and begin to go upward.
A bullish reversal pattern is a double bottom, which indicates the conclusion of a downtrend and the beginning of an upswing.
Conclusion
When price "takes a break," it usually indicates areas of consolidation, which can lead to a continuation or reversal of the current trend. These price patterns can arise in formations such as double bottoms and double tops, and trendlines are critical in detecting them.
All of the patterns described above are technical indicators that can assist anyone understand how or why an asset's price moved in a particular direction - and which direction it might move in the future. This is because chart patterns can identify regions of support and resistance, which can aid a trader in determining whether to open a long or short position, or whether to close out open positions in the case of a trend reversal.
cc;
@lenonmc21