STEEMIT CRYPTO ACADEMY SEASON 2- WEEK 6 | CRYPTOCURRENCY TRADING WITH MACD INDICATOR BY @kouba01
Hello friends,
special thanks to @kouba01 for the wonderful lecture. thumbs up.
below is my homework task.
(1a) What is the MACD indicator simply?
The MACD indicator is a tool for determining a trend's direction and strength, as well as reversal phases and potential entry and exit points. Gerald created this indicator in the 1970s, and it can be used to extract details of various extract events during trading, such as directions and market trends.
(b) Is the MACD Indicator Good for Trading Cryptocurrencies?
Yes, indeed. Since the late 1970s, many traders and investors have used these instruments to identify moving averages that indicate a new trend, whether bullish or bearish, and thus aid traders in deciding when to buy or sell.
(c) Which is better, MACD or RSI?
MACD is better because of its many functions, which make it a complete indicator. It can be used as an oscillator for trend following and to identify price reversals, and it can also be used as a trend following indicator.

(2) How to add the MACD indicator to the chart, what are its settings, and ways to benefit from them? (Screenshot required)
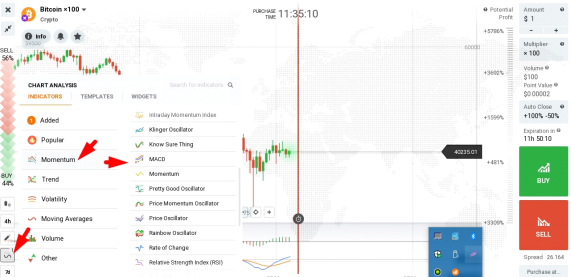
Step (1), using the IQ OPTION Platform as an example, you will see a wave single labeled indicator on the left bottom of the platform; select it.
Step (2) After you have completed step 1, you will see Momentum, which you can select. Scroll to the bottom of the page until you see the MACD indicator.
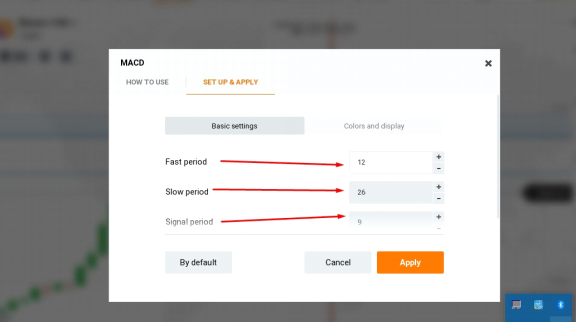
Step 3: The fast and slow periods stand for MACD line = 12 day EMA - 26 day EMA, respectively, while the signal period is the same as MACD signal line = EMA 9 of MACD value, as shown in the above diagram, after which you should click apply.
(3) How to use MACD with crossing MACD line and signal line?
Traders usually interpret the MACD line crossing above the signal line as a buy signal, while traders interpret the MACD line crossing below the signal line as a sell signal.
And How to use the MACD with the crossing of the zero line?
There is a potential buy signal when the MACD crosses the zero line on the upside. On the other hand, when the MACD crosses the zero line on the downside, it could be a sell signal.
(4a) How to detect a trend using the MACD?
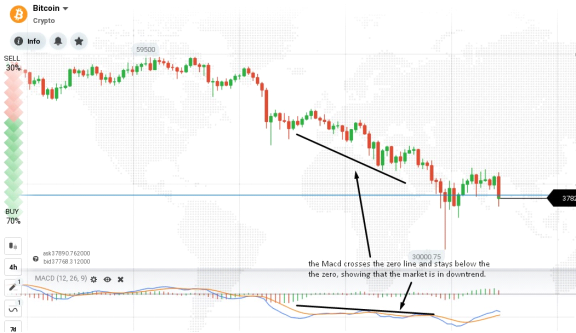
When the MACD line crosses the zero line downward, the market is said to be in a downtrend; similarly, when it crosses the zero line upward, the market is said to be in an uptrend. The histogram bars can also be used to identify trend; when the bars stay above the zero line, the market is said to be in an uptrend; when the market is in a strong downtrend, the bearish bars on the histogram are said to be in a downtrend.
(b) And how to filter out false signals? (Screenshot required)
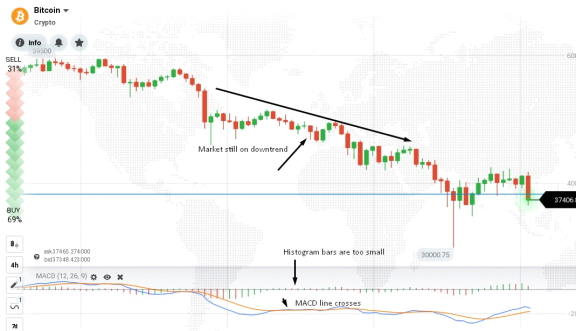
The MACD line crosses but the histogram bar (slop) remains small and the market remains in a downtrend, indicating that the MACD line crosses but remains close to the signal line. This type of crossing should not be trusted, so be patient and pay attention to the MACD line, histogram, and market direction to determine if the signal is valid.
(5) How can the MACD indicator be used to extract points or support and resistance levels on the chart? Use an example to explain the strategy. (Screenshot required)
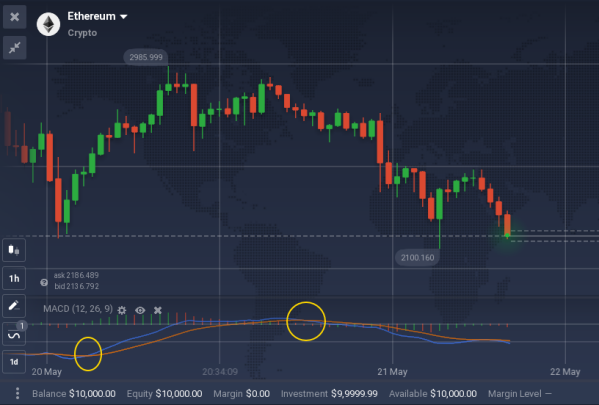
Resistance can be identified using the MACD indicator by paying close attention to where the signal and MACD lines intersect. As depicted in the graph above.
(6) Review the chart of any pair and present the various signals from the MACD. (Screenshot required)
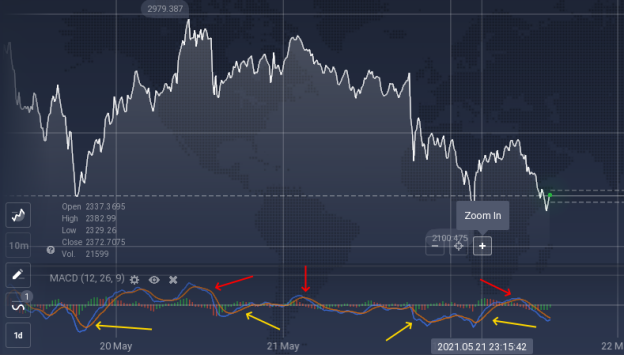
In a bearish and bullish pattern, this chart shows different movement. Bullish divergence is indicated by the red arrows, while bearish divergence is indicated by the yellow arrows.
special thanks to;
@kouba01
Hello @beautiefair,
Thank you for participating in the 6th Week Crypto Course in its second season and for your efforts to complete the suggested tasks, you deserve a 3/10 rating, according to the following scale:
My review :
An article with poor quality content, your writing style lacks a clear methodology, so we find ideas scattered with no links and what makes your answers inaccurate. Try doing more research and improving your writing style by reading good articles and citing their method until you learn a lot.
Thanks again for your effort, and we look forward to reading your next work.
Sincerely,@kouba01