[Understanding Trends II] - Crypto Academy || S5W3- Homework Post || For Professor @reminiscence01
Hello wonderful people, how are you today? I hope you're having a fantastic week. I'm ecstatic to be a part of this unforgettable lecture. In this article, I'll share my experience with Understanding Trends.


Question# 1
a) Explain your Understanding of Trend Reversal. What is the benefit of identifying reversal patterns in the Market?
A reversal is a shift in a curr's market trend. A reversal might happen on either the positive or the negative. A reversal to the downward would occur after an advance. A reversal to the upward would occur after a decline. Reversals are often focused on the entire price direction rather than one or two periods/bars on a chart.
Reversals are common in intraday trading and start immediately, or they can also develop across weeks, days, or even months. Reversals happen on a variety of time frames, each of which is important to different traders. A long-term trader looking for a reversal on daily and weekly graphs doesn't care about an intraday turnaround on a 5min chart. A day trader, on the other hand, values the 5min and 15 min reversal.
Early observation of trend reversals is critical for a successful trader. If the marketplace has been moving in one manner recently, it could be on the verge of reversing, and you should avoid placing offers at this moment. Many indicators and chart patterns can be used to forecast trend reversals.
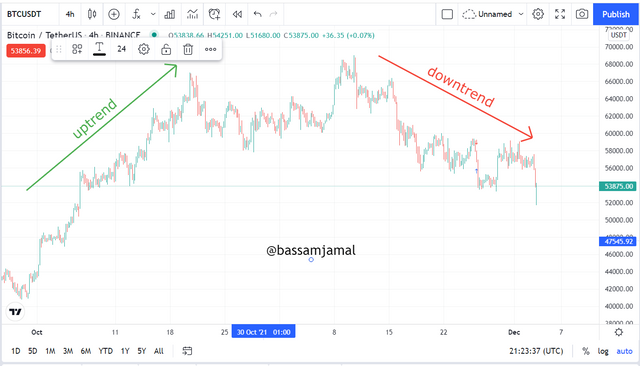
For example, in the BTC/USDT chart above, we could see that the price was trading higher for a while, but then bearish candles formed and the bears took control, resulting in a process of consolidation. As a few red candles began to form, any experienced trader would never submit a bid, but after a trend reversal was established, sell orders might be very rewarding.
b) How can a fake reversal signal be avoided in the market? (Screenshot needed)?
In the marketplace, we encounter fake reversals, which can be harmful because many investors depend on trend reversal signals. To prevent phony reversals, you must always check the change in prices with the volumes using a market strategy or indication.
Breaking of the market, breakdown of the trendline, double top and double bottom creation, and deviations are all approaches to forecast trends reversals, but no strategy can guarantee 100% accuracy. As a result, a combined strategy is always recommended. Integrating an indication with the chart pattern or by using two chart patterns to verify a reversal are examples of this.
The RSI is a confirming indicator that shows pattern intensity and velocity, as well as oversold and overbought zones. One could more be confirmed reversal by looking at the oversold and overbought levels. The RSI line swings back and forth between two peaks. Whenever the RSI line exceeds the 70 mark, we can assume that the item is overbought and there is a chance that it may retrace shortly. The asset is regarded to be in oversold condition whenever the RSI passes the 30 points, and there is a good chance it will bounce upward afterward when.
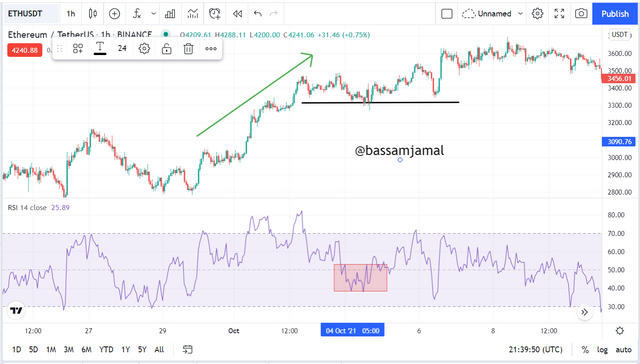
The tendency was going up in the ETH/USDT chart above, then we witnessed a lower bottom and a breakdown in the market structure, but the trend did not turn. The RSI did not cross the 30 lines, indicating that it was not an effective trend reversal pattern.
Give a detailed explanation on the following Trend reversal identification and back up your explanation using the original chart. Do this for both bullish and bearish trends (Screenshots required)?
a) Break of Market Structure
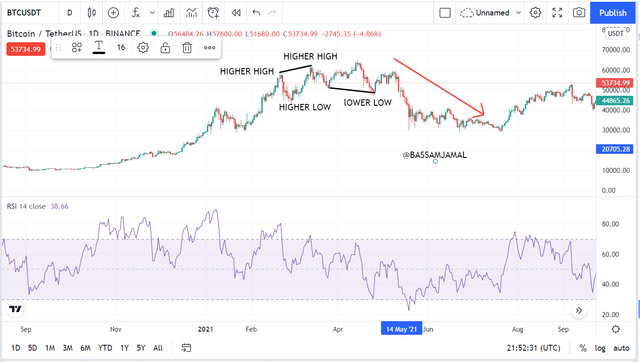
On the BTC/USDT chart below, we could see how, after a series of higher lows and higher lows, a lower low was made, which was then accompanied by a trend reversal.
We saw how various market structures exist throughout uptrends and downtrends. Such market dynamics are an indicator of pattern persistence in and of themselves. The price line produces higher highs and lower lows during an upswing, whereas the price line produces lower highs and lower lows throughout a downturn.
If you look carefully, such markets can also be utilized to predict trend reversals. For a positive trend will continue, for instance, the next high must be higher than the previous high, and the present low must be greater than the prior low. We can predict a break if this trend does not persist.
b) Break of Trendline
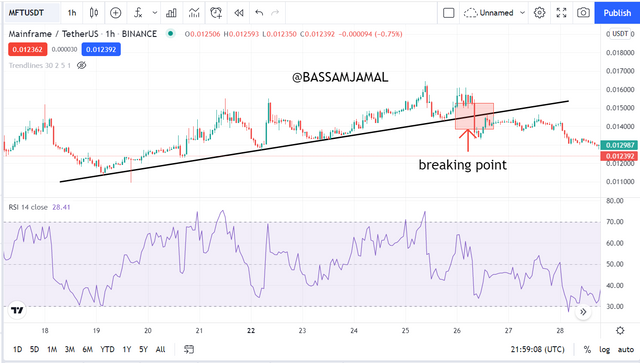
For instance, in the MFT/USDT chart below, we can see a trend line acting as dynamic support, with price maintaining it so many times until finally crossing it, suggesting a pattern reversal possibility.
A continuous trend is also indicated by trend lines. When a robust trendline crosses 2 separate price points, it indicates that the trend is legitimate. There are two types of trend lines: a downward trending line that is drawn by joining two points that act as resistance and an uptrend line that is created by joining different points that act as support.
Price frequently fluctuates about this trend line, only breaking when the trend shifts and the prior trend weakens.
For instance, in the MFT/USDT chart above, we can see a trend line acting as dynamic support, with price maintaining it so many times until finally crossing it, suggesting a pattern reversal possibility.
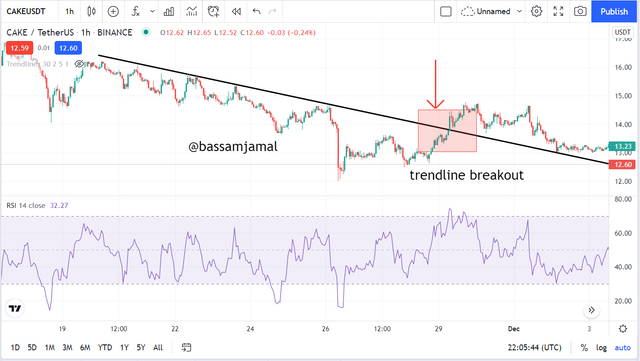
Likewise, we can see a price line breaching the bearish trendline that was formerly acting as dynamic resistance in the CAKE/USDT chart below. When the price goes through, the trend shifts from bearish to positive.
c) Divergence
Whenever the price of an item moves in the reverse way of a technical indicator, including the RSI, or in the reverse direction of all other data, this is known as divergence. Divergence signals that the present price trend is diminishing, and in some circumstances, the price will change trend.
Divergence can be both beneficial and bad. Positive divergence suggests that an increase in the asset's price is probable. Negative divergence indicates that the asset may be headed down.
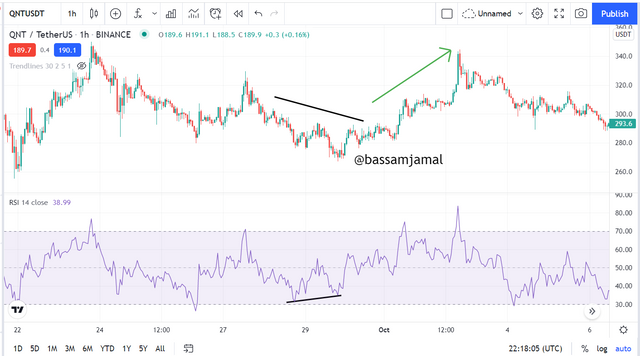
Whenever the RSI delivers an oversold value, accompanied by a higher low that corresponds to similarly lower lows in the market, this is known as a positive divergence. This suggests that bullish strength is building, and a breach above an oversold area could signal the start of a new long strategy.
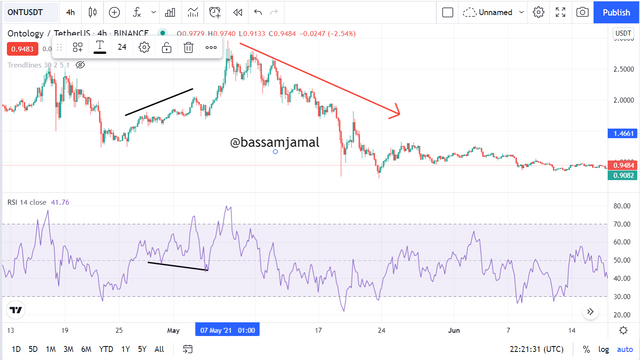
When the RSI delivers an overbought signal accompanied by a lower high that mirrors the price's higher highs, this is known as a bearish divergence.
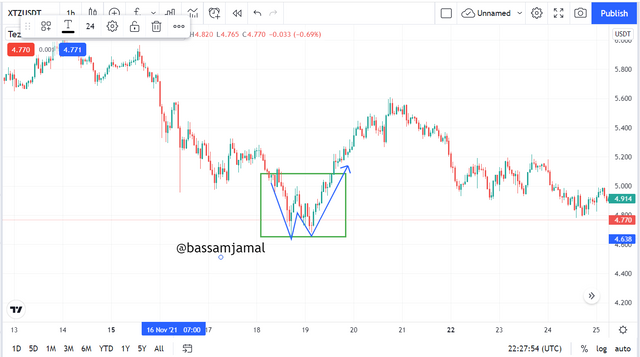
d) Double top and Double bottom
A double top is a negative statistical reversal signal that arises when an item achieves a high price two times in a row with a minor decrease somewhere between. When the entity's price goes below a supporting comparable level to the low between both the two previous highs, it's verified. It is not as obvious as one might believe since a verification with a breach beneath support is required.
A double bottom pattern is a fundamental and technical charting structure that indicates a shift in direction and a return of strength from previous leading price movement. It represents a market or statistic dropping, rebounding, dropping again to the same or comparable level as the previous decline, and finally rebounding. The double bottom resembles a letter "W." A support level is defined as a low that has been touched twice.
3. place a demo trade using any crypto trading platform and enter a buy or sell position using any of the above-mentioned trend reversal/continuation patterns
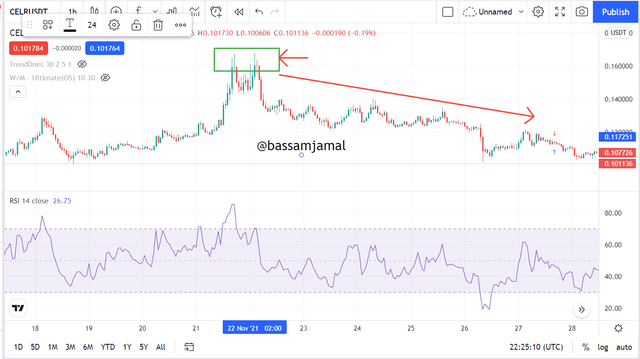
The marketplace was in a downward pattern when I entered. A negative trend line connecting a high and a lower high could be formed. The trend line could be viewed as a source of dynamic resistance.
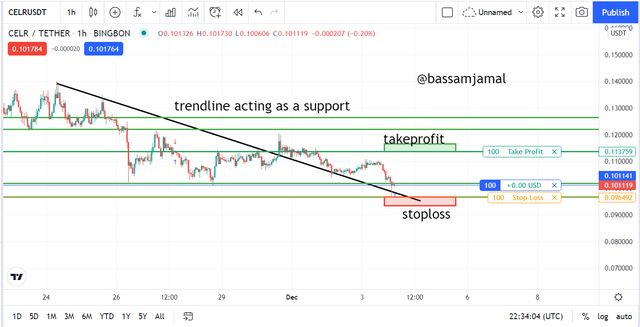
This resistance was acknowledged by the price multiple times until it was eventually broken. As you can see, the price met the active resistance and moved over it, prompting me to place a buy order.

Conclusion.
I learnt how to recognise trend reversals, what trend reversal is, and the advantages of recognizing reversal patterns. I also studied how to use market structure to enter a purchase position. Thank you for the detailed presentation, professor @reminiscence01
Hello @bassamjamal , I’m glad you participated in the 3rd week Season 5 of the Beginner’s class at the Steemit Crypto Academy. Your grades in this task are as follows:
Observations:
This is not a clear example of divergence.
Recommendation / Feedback:
Thank you for participating in this homework task.
@steemcurator02