TRADING WITH ACCUMULATION/DISTRIBUTION (AD) INDICATOR/ CRYPTO-ACADEMY S4W5 HOME-WORK POST FOR @ALLBERT.
Hello wonderful people, how are you today? I hope you're having a fantastic week. I'm ecstatic to be a part of this unforgettable lecture. In this article, I'll share my experience with TRADING WITH ACCUMULATION/DISTRIBUTION (AD) INDICATOR
1- Explain in your own words what the A/D Indicator is and how and why it relates to volume. (Screenshots needed).
A/D Indicator.
The accumulation/distribution indicator (A/D) is a periodic indicator that examines if an asset is being collected or redistributed due to volume and pricing. The A/D ratio is used to find discrepancies between asset value and volumetric flow. This gives you an idea of how powerful a tendency is. If the price is going up but the indicator is decreasing, it means that purchasing or consolidation volume is insufficient to sustain the rise in inflation, and a price decrease is likely.
- By analyzing where price concluded inside the period started range and multiplying it by volume, the accumulation/distribution (A/D) line determines market forces for a commodity or asset.
- The A/D indication is continuous, which means that the amount of one period is increased to or removed from the previous.
why it relates to volume.
It's a volume-based metric. Investors will continue to acquire the item during the consolidation period. Whenever the cost of equity is extremely low, this is referred to as a discounting cost. As a result, investors desire to purchase the item since the price is reasonable, and as more investors own, the market volume will rise. In other words, because many investors retain the assets, there is enhanced or high volume throughout the accommodations period, and the AD indicator is bull. On the other side, there'll be a period when the value of an asset has risen dramatically. It's the point at which the price has become overvalued. It is commonly referred to as a high price. And it is at that cost that dealers sell. Investors can no further retain the item at this point. As a result, they try to disseminate it. The volume starts to drop as quickly as feasible distribution. As a result, during the delivery process, volume is decreased or low, as well as the AD Indicator is negative.
It's the point at which the price has become overvalued. It is commonly referred to as a high price. And it is at that cost that dealers sell. Investors can no further retain the item at this point. As a result, they try to disseminate it. The volume starts to drop as quickly as feasible distribution. As a result, during the delivery process, volume is decreased or low, as well as the AD Indicator is negative.
2. Through some platforms, show the process of how to place the A/D Indicator (Screenshots needed).
- To clear this up, I'll use Tradingview to apply an A/D indicator to the graph. After that selection, any coin pair select the marked option in the below picture.
- a box will pop up and search the indicator there.
- after searching this indicator once clicking will add the indicator in the chart.
3. Explain through an example the formula of the A/D Indicator. (Originality will be taken into account)
I'll provide an illustration to illustrate the calculation for the A/D indicator in this section of the topic.
The algorithm for calculating AD now contains three factors.
- Money flow multiplier
- Money flow volume
- Previous Accumulation/Distribution line.
Past Accumulation and Distribution are the initial things to look for. The money flow multiplier and money flow volume are then sought out. The preceding accumulation and distribution are therefore multiplied by the result of the money flow multiplier and the money flow volume.
- AD = P (AD) + MFM × MFV
- Where AD = Accumulation/Distribution
- P(AD) = Previous Accumulation/Distribution
- MFM = Money Flow multiplier
- MFV = Money Flow volume.
For Money flow multiplier (MFM),
MFM = [(C - L) - (H- C)] / (H- L)
C = closing price
L= Low of of the price
H = High of the price
For Money flow volume (MFV):
MFV = MFM × VP
VP = Volume of the period
Now through charts,
We'll now extract information from the daily candle that was created from the image. We'll take the candle's close, high, and low points.
Closing price = 0.2071
High of the price = 0.2112
Low the price = 0.1815
the volume of the period = 210.8M
previous AD = -4.643
- Money flow multiplier = [(Close price - Low of the price) - (High of price - Close price)] / [(High price - Low of price)]
- Money flow multiplier = [(0.2071-0.1815)-(0.2112-0.2071)]/[(0.2112-0.1815)]
- Money flow multiplier = 0.6
- Current Money Flow Volume = (Money Flow Multiplier x current volume)
- Current Money Flow Volume = (0.6x210.8M)
- Current Money Flow Volume = 126.48 M
- Accumulation/Distribution = (Previous A/D)+ (Current Money Flow volume)
- Accumulation/Distribution = (-4.643M)+(126.48M)
- Accumulation/Distribution = 121.83M
4. How is it possible to detect and confirm a trend through the A/D indicator?(Screenshots needed)
I'll teach you ways to use the A/D indicator to identify and validate the trends in this section of the answer. We'll examine at how to tell when an item's price is in an upswing versus when it's in a decline. Let's start with an upward trend.
- Bullish Trend.
The market must be observed climbing up, going up, to assess and identify if a pattern is bull with the A/D indicator. The indication, A/D indicator, then must be heading in the same way as the market, that once cost has shown a sequence of higher highs and lower lows. The pattern is thus considered to be in an upward tendency.
- Bearish Trend.
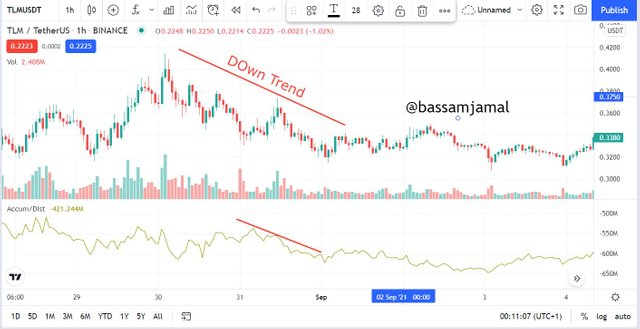
The A/D indicator may also be employed to determine whether or not a certain asset is in a downward trend. The value of the asset will be heading lower with a succession of lower lows in this scenario, and the A/D indicator will be decreasing as well. When the market and the A/D indicator are both moving in the same trend, the item is considered to be in a decline or bearish.
5 Through a DEMO account, perform one trading operation (BUY or SELL) using the A/D Indicator only. (Screenshots needed).
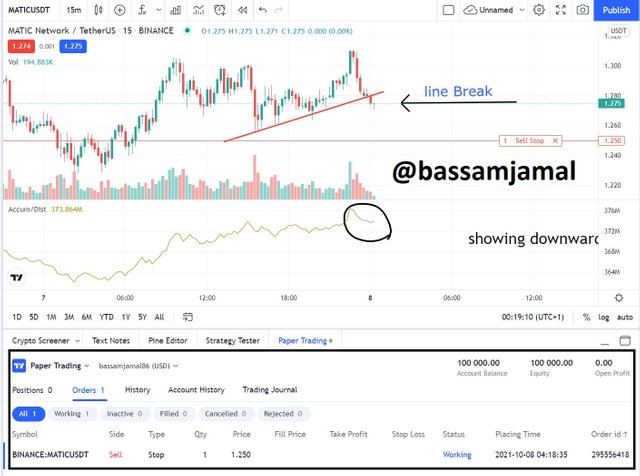
Sell Order On MATIC/USDT Using Signal From The A/D Indicator
The A/D Indicator signal was used to perform a sell order transaction. The cost was going uptrending, while the A/D line is flowing downtrending, resulting in a divergence in price action and the A/D line. On a price rise, a trend line was created in anticipation of a pattern inversion and line breakdown.
6. What other indicator can be used in conjunction with the A/D Indicator. Justify, explain and test. (Screenshots needed).
The A/D indicator, while straightforward to apply and a remarkably good indication, has certain flaws, notably a lack of sensitivity to tiny change, which implies no trade alert. In addition, the A/D indicator only examines the period close, not price movement over time.
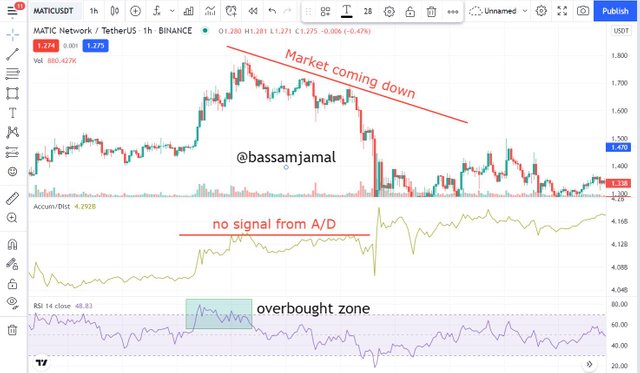
When used in collaboration with the other indications such as the RSI indicator, a momentum oscillator that displays overbought and oversold values in a commodity, the A/D indicator becomes a powerful tool.
The RSI indicator on the graph shown revealed that the market had risen to the overbought area, signaling a trading sign signaling a sell-off since the commodity had become overvalued and needed to be reversed. The A/D line, on the other hand, did not offer any indication of a sign and simply went in the path of the price.
The RSI indicator may be used with the A/D indicator in a variety of ways to generate trading predictions.
Conclusion.
The ADL is a useful tool for highlighting sellers' and buyers' momentum on a company or asset. It's also a fantastic method to verify a current pattern. One method of analyzing a currency is to use only the A/D line. It may also be utilized to refine a study when combined with RSI
Whenever there is a difference in price movements and the A/D line, the A/D signal can also anticipate pattern downturns. It is best used in conjunction with the other indicators for stronger trade predictions.
cc: @allbert


