Trading Crypto with Aroon Indicator- Crypto Academy / S5W2 - Homework Post for @fredquantum.
Hello wonderful people, how are you today? I hope you're having a fantastic week. I'm ecstatic to be a part of this unforgettable lecture. In this article, I'll share my experience with Trading Crypto with Aroon Indicator.


Question (1)
What is Aroon Indicator in your own words? What are Aroon-Up and Aroon-Down? (Show them on Chart).
The Aroon indicator is a technical indicator that may be used to detect market pattern alterations as well as the intensity of that movement. In general, the indicator determines the time between highs and lows over a given period of time. The concept is that powerful uptrends will see record highs on a frequent basis, whereas severe pullbacks would see new lows on a regular basis. When this happens, the indicator flashes, and when it doesn't, the indicator flashes.
The Aroon indicator is a technical indicator that is primarily used in pattern recognition. It does so by perusing or assessing the moment among highs and lows, and thereby, the Arron indicator detects adjustments in pattern movement as well as validates the trend or resilience of a particular trend.
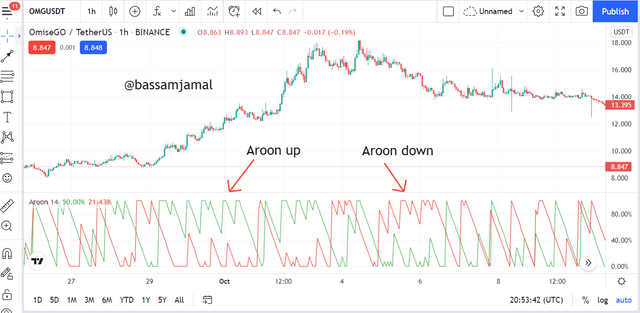
The Aroon-Up
Whenever its line passes above the Aroon-Down line, the Aroon-Up is one of the Aroon indicator lines that is used to determine a bullish trend direction or intensity. Whenever the Aroon-Up line passes above the Aroon-Down line and sustains a continuous flow above it, the power of the movement is also detected.
The Aroon-Down
Whenever its line crosses over the Aroon-Up line, the Aroon-Down is one of the Aroon indicator lines that is used to signal a Bear market direction urge or motion. Whenever the Aroon-Down line remains above the Aroon-Up line, the robustness of the movement is also established.
Question (2)
How is Aroon-Up/Aroon-Down calculated? (Give an illustrative example).
For Aroon up
Aroon-Up = [(nPeriod – Periods Since the Highest High within nPeriod ) / nPeriod] x 100
For Aroon down
Aroon-Down = [(nPeriod – Periods Since the Lowest Low for nPeriod ) / nPeriod] x 100
- For example, if the Aroon-Up period is 12 and the time since the highest high within nperiod is 6
Therefore Aroon-up = ((12 - 6)/12) x 100
Aroon-Up = (6/12) x 100
Aroon-Up = (6/12) x 100
Aroon-Up = 0.2 x 100
Aroon-up = 20
- Similarly, if the Aroon-Down period is 12 and the period since the lowest low within nperiod is 2
Therefore Aroon-Down = ((12 - 2)/12) x 100
Aroon-Down= (10/12) x 100
Aroon-Down = 0.83 x 100
Aroon-Down = 83
The Aroon-Down line is presently well above Aroon-Up line, indicating a Bearish motion or pattern, as seen by the two computations above.
Question (3)
Show the Steps involved in the Setting Up Aroon indicator on the chart and show different settings. (Screenshots required)
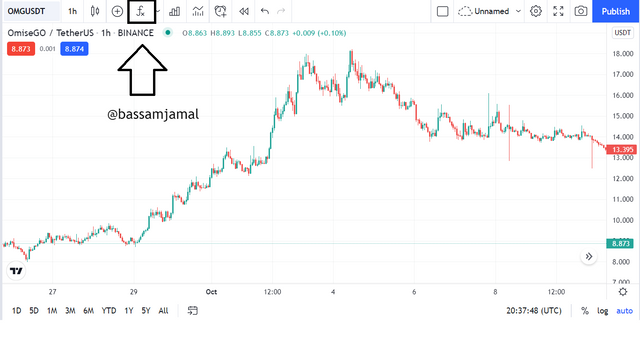
Visit the Tradingview Charting interface to set up the Aroon indicator and trade any pair you want.
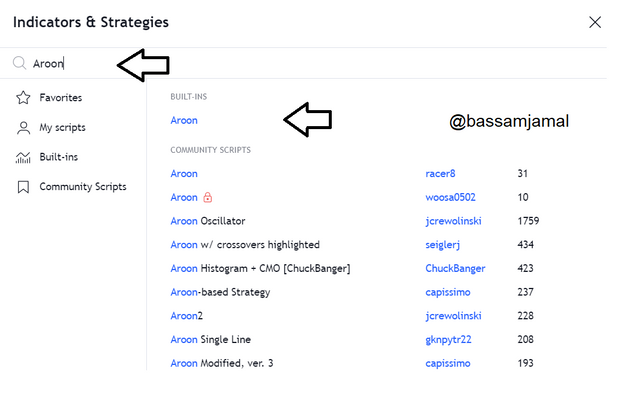
- The first step is to select the Indicator icon at the top of the screen.
- The next step is to search for Aroon here.
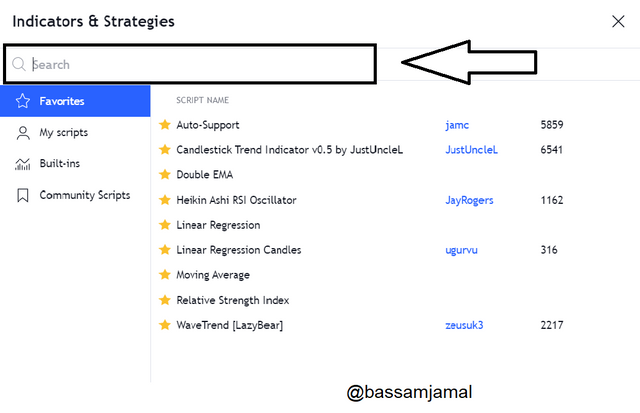
- Like this and the click in arrowed indicator
- then it will appear like this.
- The steps to modify the Aroon Indicator are listed below.
- Select the options icon in the chart's lower-left corner.
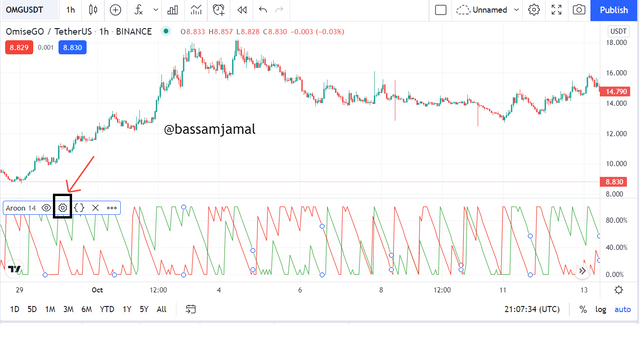
After you click it, a pop-up box will open at the front of the graph with various Aroon indication adjustment settings, including Inputs, Style, and Visibility.
- The inputs part provides alternatives for choosing a period and the number of periods or durations from which a user may pick. This indicates that you can select a time frame
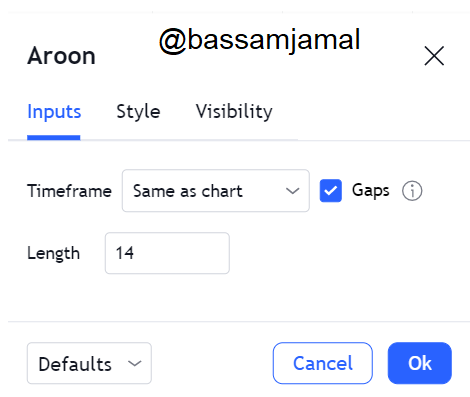
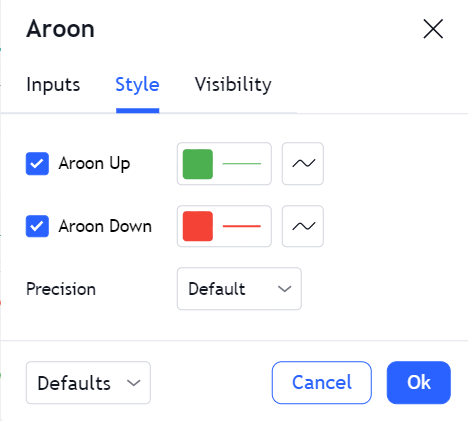
- The Style option feature is used to provide coloring to any of the Aroon lines, whether Up or Down, with the goal of distinguishing the two lines to match the observer or user.
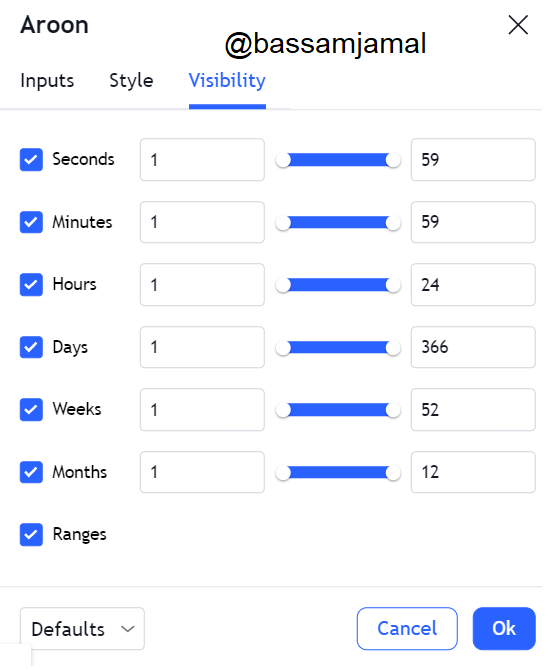
- On the Aroon display screen, the visibility adjustment or configuration option works with what the person wants to view. This implies that the consumer can remove up the disturbance.
Question (4)
What is your understanding of the Aroon Oscillator? How does it work? (Show it on the chart, kindly skip the steps involved in adding it).
The indicator has two lines: an Aroon Up and an Aroon Down. Bullish strength and momentum are represented by the Up line, whereas bearish strength and tempo are represented by the Down line. Both lines are displayed on a graph with a 0 to 100 scale, with 100 indicating the greatest pattern. Crossovers are one application of the indication. It is a bullish indicator when the Up line passes higher, and a bearish signal whenever the Down line passes larger. Stability is indicated if both lines remain below 50.
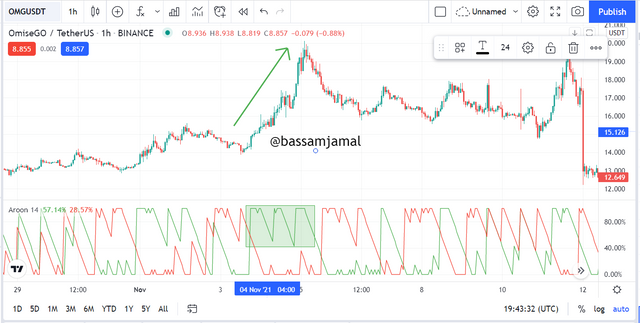
Bullish Signal
The Aroon oscillator line must go over 0 or the center point to indicate an uptrend.
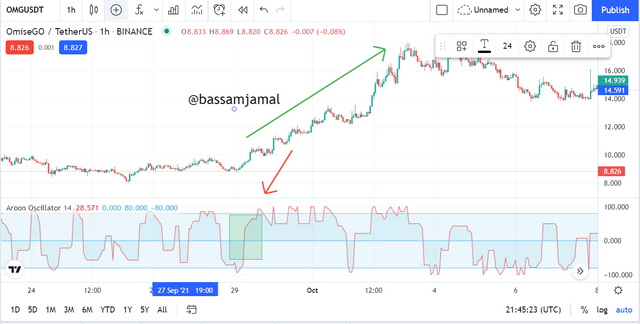
A Bullish trend was indicated by the crossover of the Aroon oscillator just above middle or zero line, as shown in the graphic above.
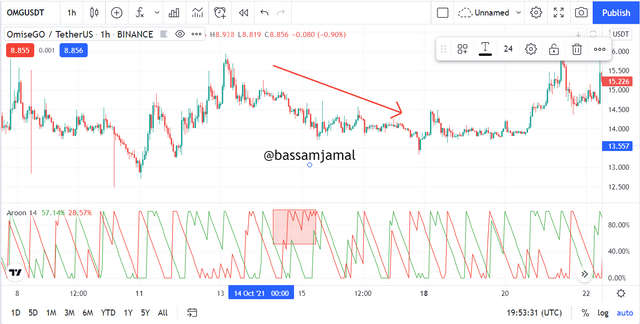
Bearish Signal
When the Aroon Oscillator line falls below 0 or the centre line, a Bearish tendency is signalled.
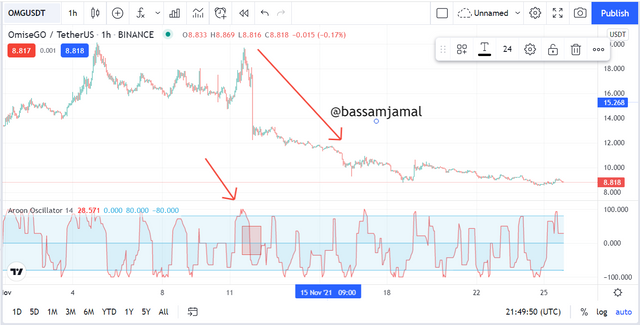
A Bearish pattern was detected by the crossover of the Aroon oscillator underneath the zero or center line, as shown in the picture above.
Because the Aroon oscillator outputs are obtained by negating the quantities of the Aroon-Up and Aroon-Down, the Aroon oscillator formula is given:
Aroon Oscillator = Aroon Up-Down
For instance, I'll use the formula above to perform a calculation.
If Aroon Up is equal to 40,
Aroon-Down is equal to 80.
As a result, the Aroon Oscillator value is between 40 and 80.
As a result, the value of the Aroon Oscillator is -40.
The Aroon oscillator's present value of -40 indicates that the Oscillator line is presently in a Downtrend.
Question (5)
Consider an Aroon Indicator with a single oscillating line, what does the measurement of the trend at +50 and -50 signify?
As explained previously, the Aroon oscillator is a single line oscillator with a span of -100 to +100 with a center-line of 0. A Bullish trend is indicated by moving off the Aroon oscillator line just above 0 or centerline, while a Bearish movement is shown by the motion of the line underneath the 0 or center point.
To determine if a movement is significant or has persistence, the Aroon oscillator line must pass up or down +50 and -50 ranges, accordingly, to demonstrate that a Bullish and Bearish pattern has significant support.
Question (6)
Explain Aroon Indicator movement in Range Markets. (Screenshot required)
A range market is the one where there were no clear trends, either bullish or bearish, and instead, the price goes sideways. In a ranging market, however, neither consumers nor sellers have complete control.
The Aroon Up and Down lines do not cross over each other in a ranging market, but rather represent sideways motion.
Question (7).
Does Aroon Indicator give False and Late signals? Explain. Show false and late signals of the Aroon Indicator on the chart. Combine an indicator (other than RSI) with the Aroon indicator to filter late and false signals. (Screenshots required).
The Aroon Indicator, like every indicator in the cryptocurrency world, is vulnerable to inaccuracies and occasionally sends out false indications. Together with erroneous signals, it can also send out lagging signals, that means it sends out messages late at sometimes. Firstly, let's look at the Aroon indicator misleading indications.
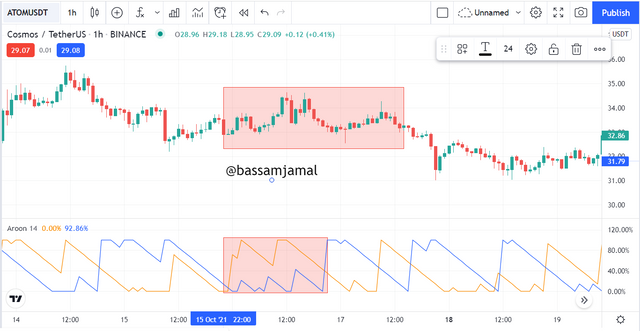
The Aroon Up line crosses the Aroon Down line on occasion, indicating a potentially buying opportunity. The marketplace, on the other hand, does not move upwards, but rather down. The ATOM/USDT chart below is an instance of a misleading signal:
You can clearly see that the Aroon down moved up Aroon up, but the price moved upwards instead.
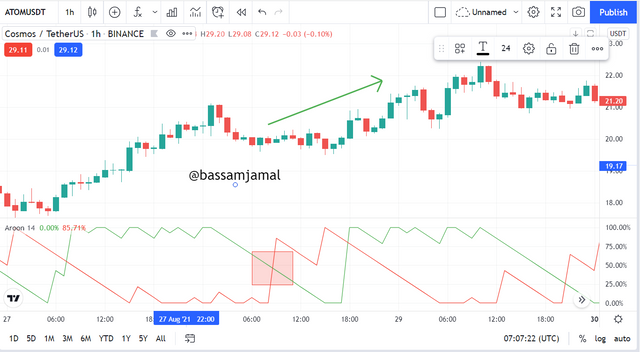
- The Aroon Indicator generates lagging indications occasionally, causing the train to depart before you ever enter. On the ATOM/USDT chart below, a comparable lagging indication was evident, where the bullish movement already had set off and the Aroon indicator signaled it later.
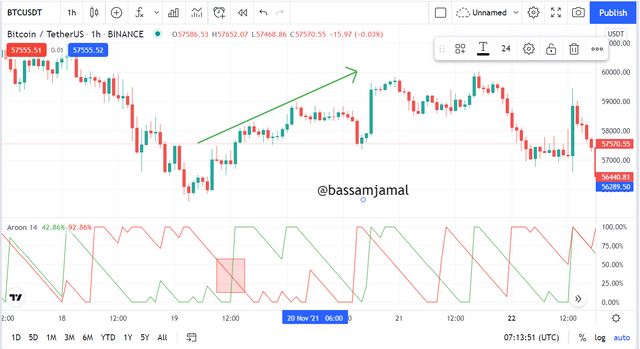
Combining MA Cross with Aroon Indicator to filter late and false signal
The MA Crossline has crossed candles in the chart above (uptrend). This allows the trader to sort out any misleading or late signals that the Aroon indicator may present. Well before the Aroon indicator reveals a cross-over, you can see that the MA has already passed.
To exclude out late signals, the MA indicator might be employed.
Before the Aroon Indicator shows a crossover, it will reveal the new trend.
Filtering misleading signals is also possible with the DMI indicator.
Its movement will be in sync with the prevailing fashion trend at the time.
Question (8)
Place at least one buy and sell trade using the Aroon Indicator with the help of the indicator combined in (7) above. Use a demo account with proper trade management. (Screenshots required).
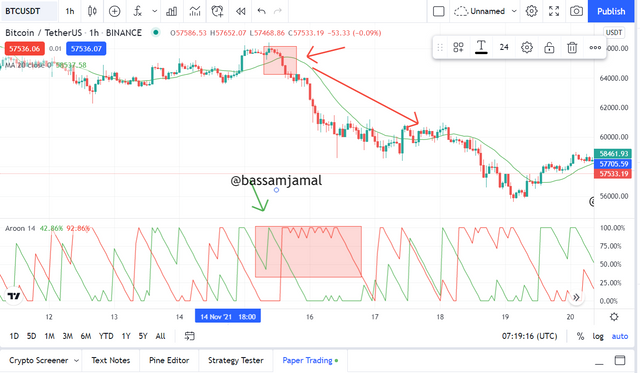
Placing a SellTrade
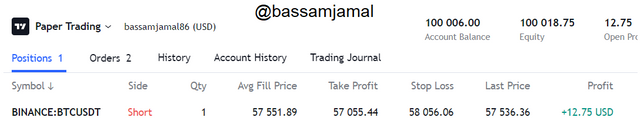
To put a sell/short order on the BTCUSDT pair, I entered the market. I was also keeping an eye on the market using a combination of the Aroon indicator and the moving average. The Aroon-up line has fallen below the Aroon-down line. The MA cross line has also gone above the candles. As a result, I decided it was a good moment to sell/short because such action indicates a downturn.
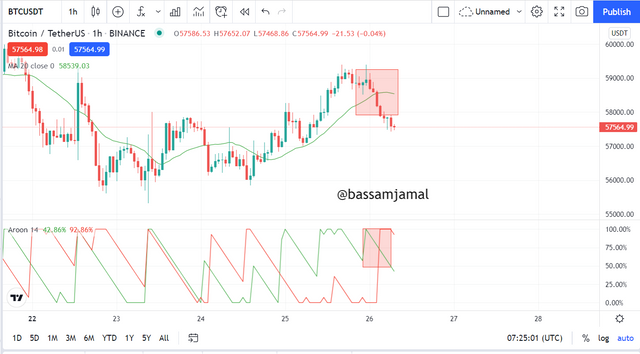
At that time the price of BTC was $57551 I then set my take profit at $57051 and set my stop loss at $58056.
Placing a buy trade.
To put a Buy/long order on the ADAUSDpair, I entered the market. I was also keeping an eye on the market using a combination of the Aroon indicator and the moving average. The Aroon-downline has fallen below the Aroon-upline. The MA cross line has also gone below the candles. As a result, I decided it was a good moment to Buy/long because such action indicates a uptrend.
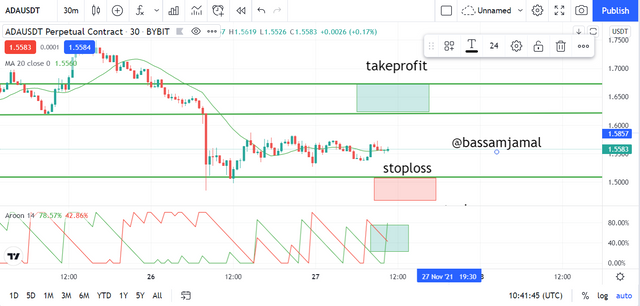
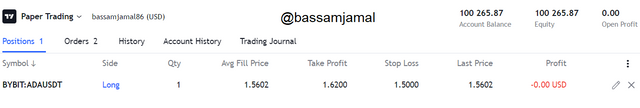
At that time the price of ADA was $1.56 then set my take profit at $1.62 and set my stop loss at $1.50.
Question (9)
State the Merits and Demerits of Aroon Indicator.
Merits.
- The lines can be interpreted in a number of ways, none of which need difficult algebraic calculations.
- Line crossings can alert investors to an up or down in movement.
- Traders can adjust the length of the time frame used to calculate the Aroon Lines depending on how often they trade.
- The Aroon indicator can be customized according to the trader's expertise and investing style.
I- n a trending market, the Aroon indicator performs well.
Demerits.
Because the Aroon Lines are dependent on the previous pricing, they will appear later than the overall trend.
The indicator will not provide any indication on the extent of movement that could occur because it simply reflects on how time afterward the last high/low occurred.
The indications presented may not always be correct when used alone, so it's always best to combine them with other indications.
It is a poor indicator that produces late alerts.
Conclusion
To summarise, the Aroon indication is one of the most popular customizable trading indicators on the market today. It can take the place of the classic averaged direction trend indicator that is featured on most trading and analyzing programs.
Investors use the Aroon oscillator to identify the trend's intensity. The rising and falling lines of the oscillator assist the investor to see when the prices are moving and while they are settling.