Steemit Crypto Academy | Season3|Week 2: The Market Structure Break(MSB) strategy for trading reversals - Homework task for @cryptokraze
What is the Market structure
The price patterns arrangement that the marketplaces adopt as it proceeds through one price range to the next is considered a Market Structure. The market goes in a skid or wave-like pattern instead of in a single direction. In an "increasing trend," "downward trend," or "consolidation pattern," they can travel upward, downward, and sideways.
Supports and resistance on the chart and swinging ups and downs are all examples of market structure. These are all the areas on your graph that get more interest. And when you integrate candlesticks formations with market structure, you're essentially aiming to initiate trading after significant price resistance.
Upper Trend.
Down Trend
Sideways.

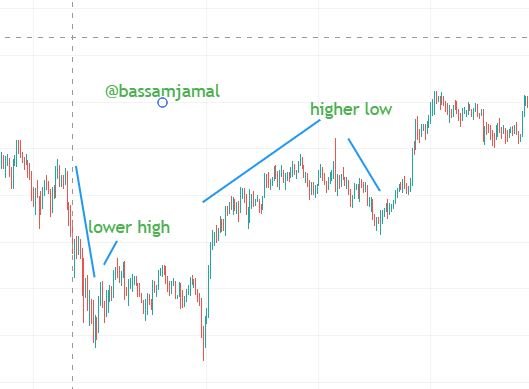
What do you understand about Lower High and Higher Low? Give Chart Examples from Crypto Assets.
If the coin's "down" price continues to rise so over course of several trading days, and if you witness "higher lows," the coin is now in an upswing. The coin, but on the other side, is indeed in a downwards trend if its high values are dropping, and if it has "lower highs."
Traders use highs and lows as significant markers. These are considered vital marks, particularly in daily charts. This is due to the close connection with trend identification inline charts. The upward trend is defined by higher highs and lower lows. A downward trend is defined by lower highs and lower lows.
How will you identify Trend Reversal early using Market Structure Break? (Screenshots Needed)
The Market Structure Break is a method that can be utilized to spot a trend reversal quickly. It is fairly comparable to spot the trend reversal this Market Structure Break for both uptrend and downtrend, so I will showcase this with a picture.
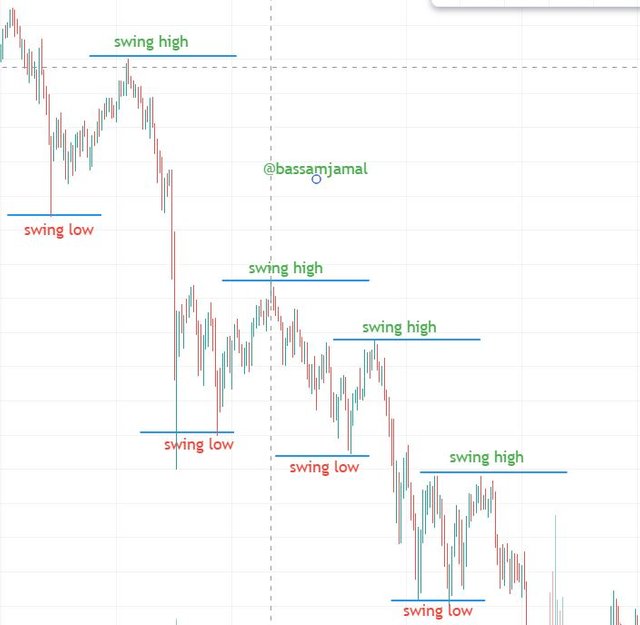
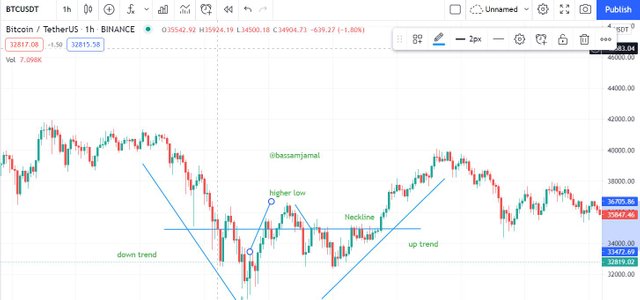
Trend Reversal after a downTrend.
Market Structure Break technique can be highly useful to trading in identifying trend direction early in a downturn. A Higher low is established just below a downwards trend of the market in which a sequence of Lower lows was already created, and it is regarded as a sign of bullish divergence.
- Higher Low must be formed at the end.
- Neckline must be broken.
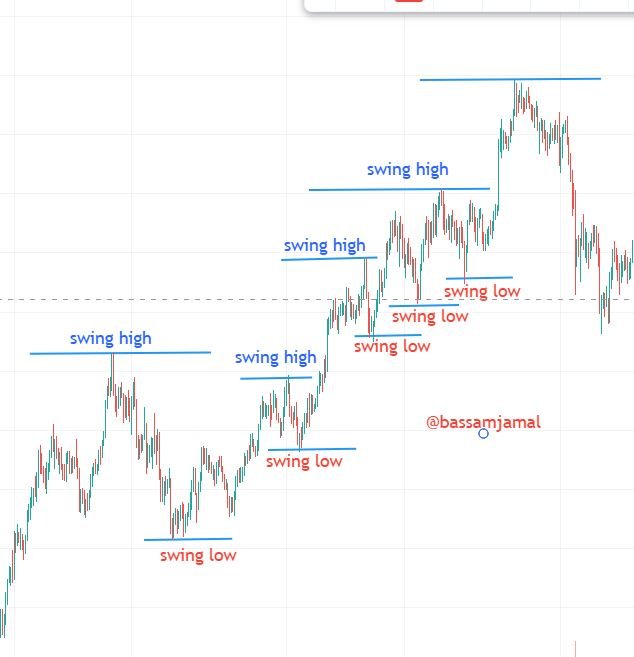
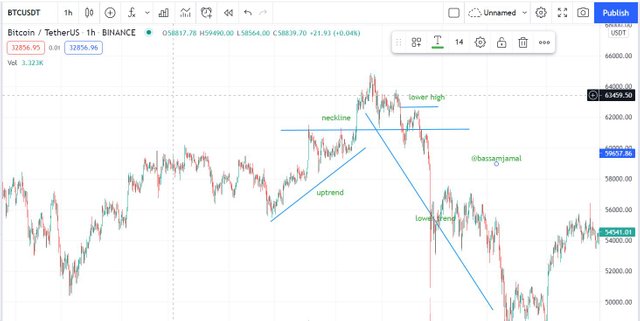
Trend Reversal after an UpTrend.
When a sequence of higher highs is established while on an up-trending trade, and a Low High is established only at top of the market, it is a sign of bearish divergence, and a downturn is predicted to begin.
- Low high must be formed.
- neckline must be broken.
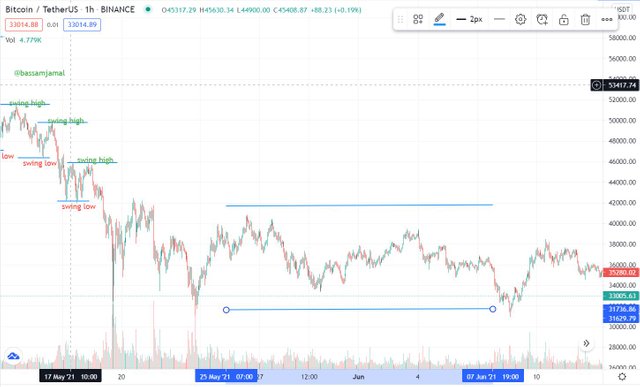
Explain Trade Entry and Exit Criteria on any Crypto Asset using any time frame of your choice (Screenshots Needed)
In a transaction, you cannot choose your entry/exit prices at your will. This is a speeding train that you must board at the appropriate time. Opening the market includes implementing the buy-sell cycle's initial orders.
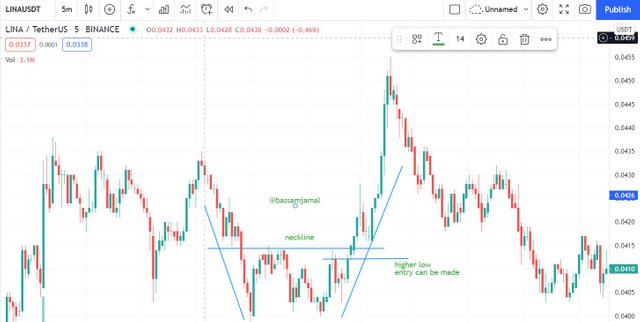
Buying criteria.
- market must be in a downtrend.
- a higher low must be formed at end of a downtrend.
- neckline must be broken after trend reversal.
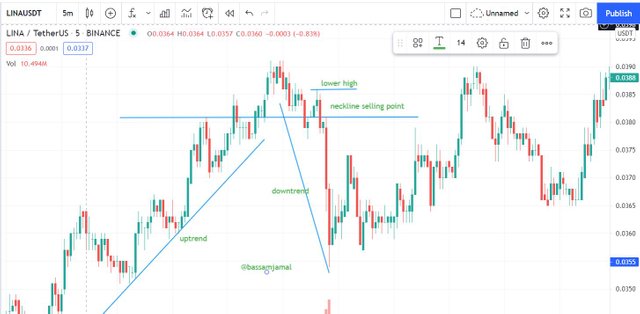
selling criteria.
- sell at trend change of market after bullish.
- market must be in an uptrend.
- sell after candle breakage of the neckline.
Place 2 demo trades on crypto assets using Market Structure Break Strategy. You can use a lower timeframe for these demo trades (Screenshots Needed)
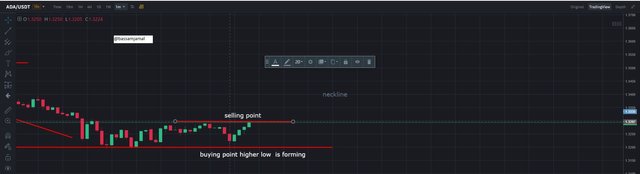
1st demo entry.
-ADA/USDT
-buying point: 1.320
-higher low is formed.
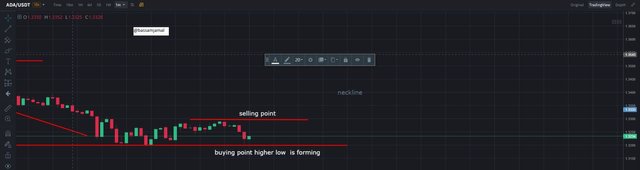
-sell point: 1.3311
-lower high formed.
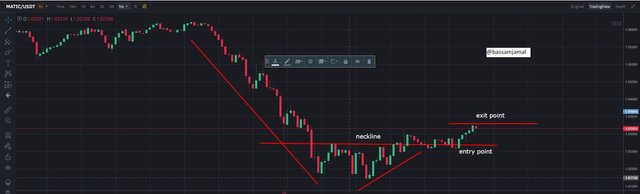
2nd demo entry.
-MATIC/USDT
-buying point: 1.02572
-higher low is formed.
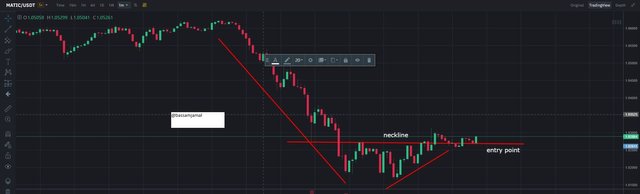
-sell point: 1.0275
-lower high formed.
Conclusion :
The prices of assets are constantly fluctuating. There really is no such thing as an infinite rise or drop. The price movements from an upswing to a downturn after completing an upward. Its can be a good strategy for gaining minimal profits in short term trades and I learned very much while creating this post.
Cc: @cryptokraze