Crypto Trading With Chaikin Money Flow Indicator - Crypto Academy - S4W6 - Homework Post for @kouba01
Hello wonderful people, how are you today? I hope you're having a fantastic week. I'm ecstatic to be a part of this unforgettable lecture. In this article, I'll share my experience with Crypto Trading With Chaikin Money Flow Indicator.

Question no.1
In your own words, give a simplified explanation of the CMF indicator with an example of how to calculate its value?
CMF indicator.
Chaikin Money Flow (CMF) is a technical indicators tool that is used to calculate Money Flow Volume above a specified timeframe. Money Flow Volume (originally developed by Marc Chaikin) is a measurement for identifying a currency's purchasing and selling power over a specific time period. The total Money Flow Volume over a user-defined peek time is then calculated by CMF
The market action is shown by two lines in these Indicators: upward and downward. The Chaikin Money Flow (CMF) gauges buy or sell forces and determine whether the price is rising or falling at a certain point.
Whenever the CMF curve approaches or perhaps hits the range's maximum level, specifically point 1, it shows that purchasing activity has increased, resulting in higher buying power than selling pressure.
When, on the contrary, the CMF line approaches or hits the lower bound of the -1 region, it indicates a spike in selling activity, indicating that more individuals are selling than purchasing during that timeframe.
Calculating the value of Chaikin Money Flow (CMF)
For Calculating the Money flow multiplier = [(Close price - Low price) - (High price - Close price)] / (High price - Low price)
For Calculation of the Cashflow volume = cash flow multiplier x volume for the period
For Calculation of Chaikin Money Flow = sum of 20 or 21 periods of cash flow volume/sum of 20 or 21 periods of volume
- Now take some assumed values and find out CMF by putting in the above formula.
High : $500
Low : $300
Close : $475
21 Period Sum of Volume : $200
Volume for the Period : $100
For Calculating the Money flow multiplier:
Cash Flow Multiplier = [(475 - 300) - (500 - 475)] / (500 - 300)
Cash Flow Multiplier = 150/200
Cash Flow Multiplier = 0.75For Calculation of the volume of cash flows:
Cash flow volume = 0.75 x 100
Cash flow volume = 75For Calculation of Chaikin Money Flow:
Chaikin Money Flow = 75/200
Chaikin Money Flow = 0.375
Therefore, one can notice given the above that we computed Chaikin Money Flow from the commodity price and volume, and we got the number of 0.37 for Chaikin Money Flow.
Question no. 2
Demonstrate how to add the indicator to the chart on a platform other than the tradingview, highlighting how to modify the settings of the period(best setting).
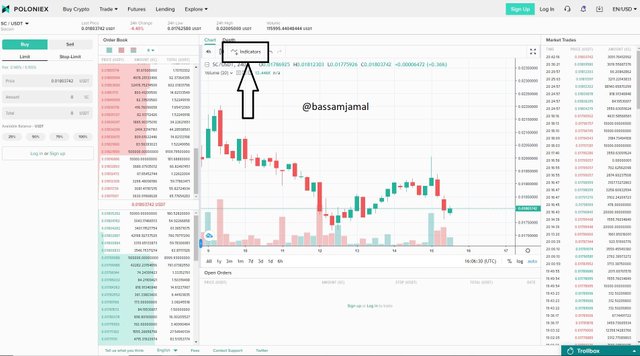
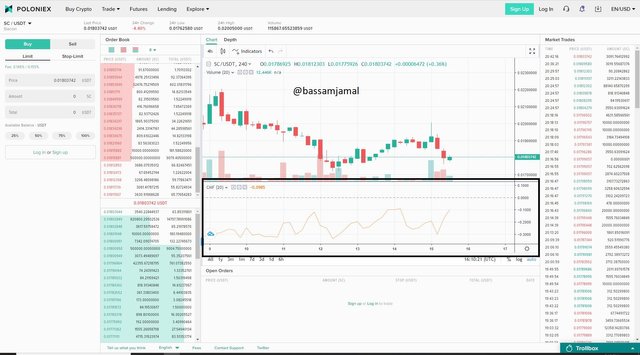
Poloniex will be used to introduce the Chaikin Money Flow to Graphs.
after reaching the website we will see this web display and we will click on trade as shown in the picture below.

- after clicking on trade click on spot.

- then we will click on the indicator as you can see the marked part in the picture.
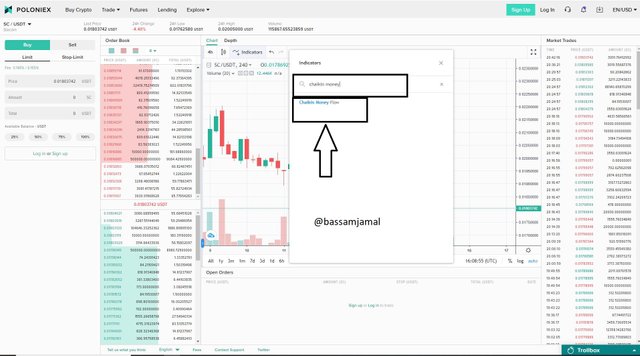
- a new window will appear and in the search bar, we will search for Chaikin Money Flow Indicator and click it to add in the chart.
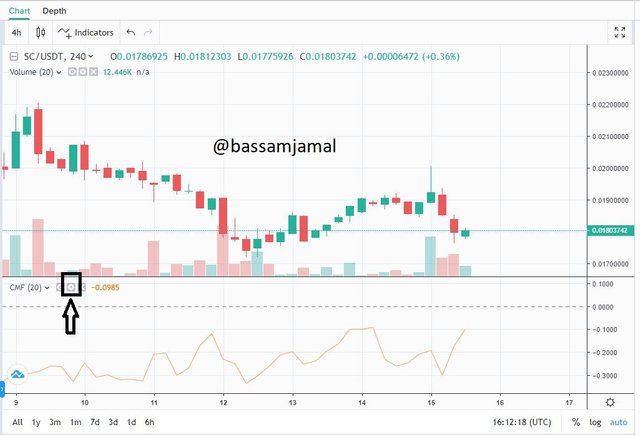
- as you can see the indicator is finally added to the chart.
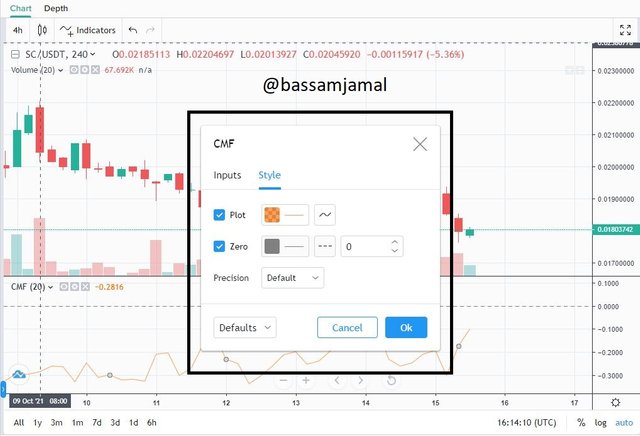
- by clicking on the setting icon we can change the style, color settings.
- We could change the color of the Chaikin Money Flow oscillatory line as well as the Zero line in the Styles panel.
- Then, in Input, we may change the length/periods, which are set to 20 by the standard.
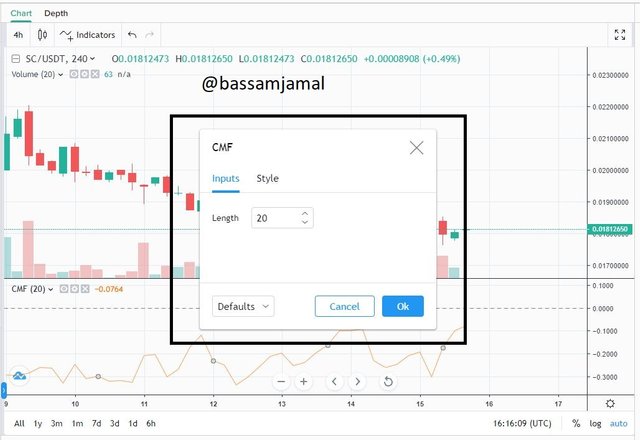
Choosing the best settings.
- The default setting for the Chaikin Money Flow Indicator is 20, although Marc Chaikin recommends adjusting it to 21. But also relies on the investors; whether they are researching a short time frame, they would generally lower the period from 21 since it offers a quicker reaction.
- If we go under 21, the indicator will have significant levels, and it may also give false indications, therefore it is mostly employed by shorter-term investors. Increasing the period from 21 to receive a slower reaction and fewer trade indications, however, the indicator will be less unpredictable, which is why it is usually employed by long-term investors.
Question no.3
What is the indicator’s role in confirming the direction of trend and determining entry and exit points (buy/sell)?
The CMF indicator aids in evaluating the currency's collection and redistribution rates, as well as the purchasing and selling activity of investors for a certain commodity over a given period of time. Whenever there is a lot of accumulation, it implies the purchasers have a solid market position, but a lot of dispersion indicates the sellers have a lot of power.
We may use the CMF indicator to predict either bullish and bearish trend orientations. Will see how we can predict.
Buying point.
When the oscillation line of the Chaikin Money Flow indicator crosses the zero line, it indicates that the price has begun to go up. This really is usually the entry point for investors, and usually purchase at that time.
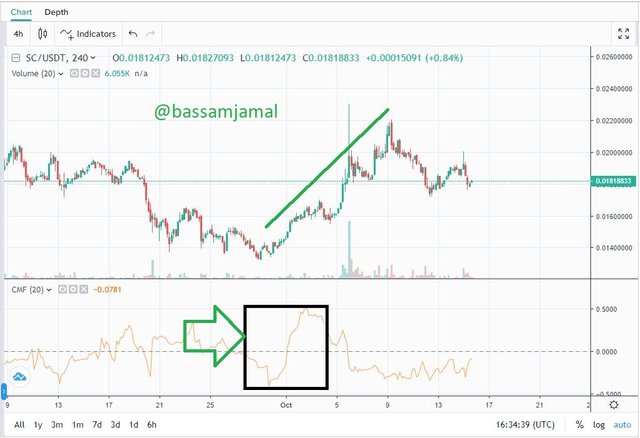
selling point.
When the oscillation line of the Chaikin Money Flow indicator falls beneath zero, it shows that the price has begun to go lower. This is usually the departure point for investors, and they sell at that moment.
Question no. 4
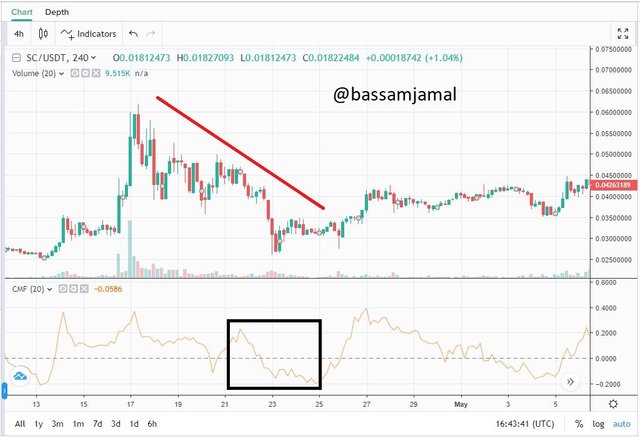
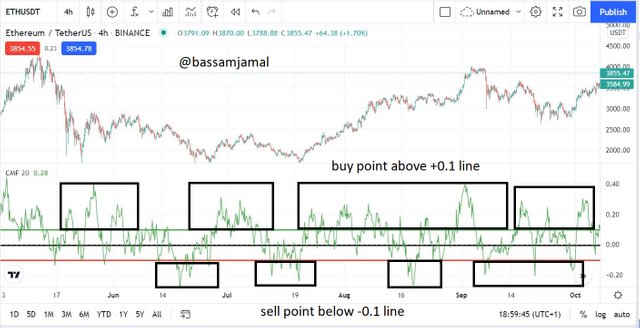
Trade with a crossover signal between the CMF and wider lines such as +/- 0.1 or +/- 0.15 or it can also be +/- 0.2, identify the most important signals that can be extracted using several examples.
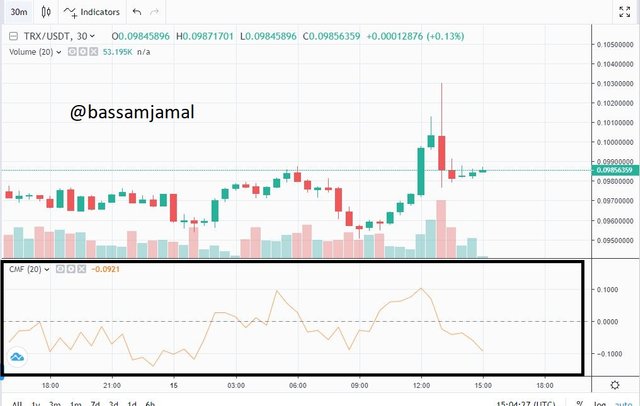
Crossover signal here between CMF occurs whenever the CMF's oscillation line crosses along each zero line each or many candles, causing investors to become misled and lose money. An instance of a Crossover signal between both the CMF is given here: As can be seen, the Chaikin Money Flow (CMF) line crosses over and under the 0 line on several occasions.
In this scenario, most individuals become scared or disturbed, and they find themselves at a loss. To deal with this, we use a cross signal between both the CMF and broader lines, such as +/- 0.1, to trading.
You can see in the below chart that whenever it gets over the 0 marks, we wait for the line to move above + 0.1, and then we have a Purchase Call.
Likewise, if the line falls underneath the zero line, then should watch for it to reach the -0.1 level before entering a SELL Call.
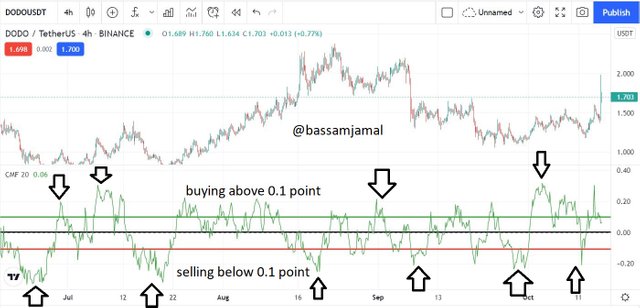
Another example.
Question no. 5
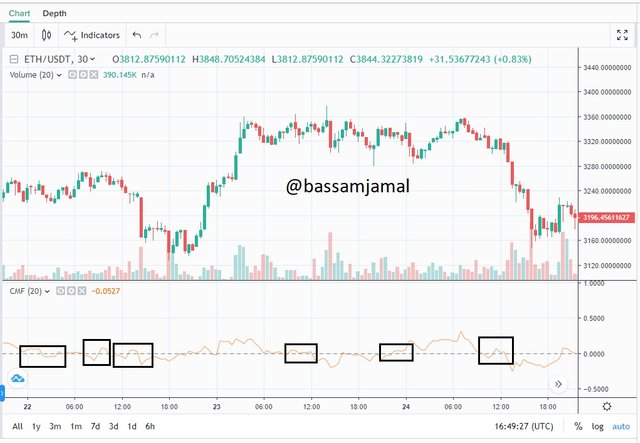
How to trade with a divergence between the CMF and the price line? Does this trading strategy produce false signals?
Divergence Trading Here between Chaikin Money Flow (CMF) as well as the Price graph, we could observe that the coin value is going in one way while the Chaikin Money Flow (CMF) figure is flowing in a reverse way.
Any such divergence among coin price and Chaikin Money Flow (CMF) number suggests that the present movement is going to disappear so a trend reversion is likely possible. Bullish Divergence and Bearish Divergence are two forms of divergence that can occur between both the coin price and the value of Chaikin Money Flow (CMF).
Bearish Divergence.
The Bearish Divergence, in a contrast to the Bullish Divergence, happens whenever the CMF indication trend is indicating a bearish motion, but the market is in an upward motion, with the prior and subsequent highs being higher. Once it is discovered, a bearish reversing signal is generated, indicating that money is moving from selling to buyers, providing buyers confidence.
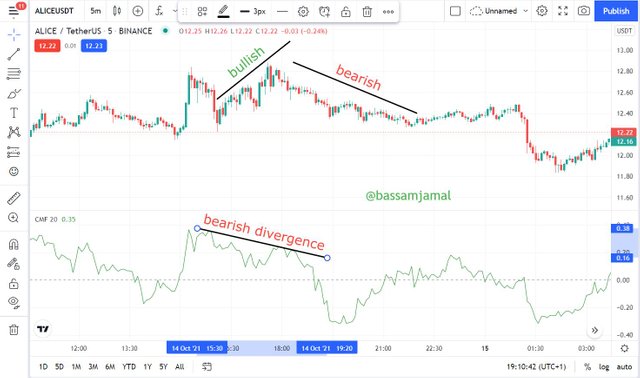
There is a bearish divergence when looking at ALICEUSDT, as shown in the picture before, as the market continues to rise but the signal FROM cmf continues to fall. The price begins to fall when the signal verifies the bearish divergence.
Bullish Divergence.
The CMF indicator line suggests a bullish rise whereas the price action indicates a negative movement in the Bullish divergence. There is usually a bullish trend turnaround in the market when the CMF bullish divergence is present.
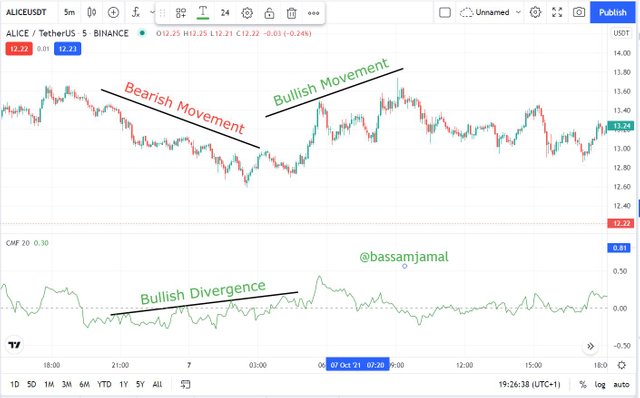
The price action was lowering in an opposite direction to the indication at the point when the bullish divergence was established in the CMF, and following the Deviations, the market began to suffer a turnaround and a positive movement occurred in the value, as seen on the ALICEUSDT Chart. Divergence is commonly used by traders to benefit from transactions.
Does this trading strategy produce false signals?
CMF can provide misleading indications since it is not intended to be used as a trading platform; instead, it's being used to validate a market trend or other technical analysis. None indicator is 100 percent accurate; if it were, investing would have been the quickest and easiest way. Combining the CMF indicator with other technical indicators is the greatest way to enhance the value of investment opportunities while also filtering out those that aren't.
Conclusion
The CMF is a useful volume-based indicator that shows the currency's situation is reliant on value consolidation and dispersion, allowing traders to spot price purchasing and selling action. The different indications supplied by this indicator don't really enable us to detect the item's value trend in the marketplace throughout a particular period's entrance and departure places, and also patterns and divergences. The CMF indicator is a volumes indicator that investors utilize to benefit from price changes in proportion to volume transacted over a given time period. It gives us insight into the market's future trends. The CMF indicator makes detecting bullish and bearish divergence simple.
cc : @kouba01
Hi @bassamjamal
Thanks for participating in the Steemit Crypto Academy
Feedback
Total| 6/10
This is fairly done. Your article lacked an in-depth and a more clear analysis of the information regarding trading using the Chaikin Money Flow Indicator.
Fantastis
https://t.me/joinchat/1-4_aqg3A6BmNjJk