Crypto Academy Season 03 - Week 06 | Advanced Course - Trading Liquidity Levels The Right Way
QUESTION NO: 1
1 - What is your understanding of the Liquidity Level. Give Examples (Clear Charts Needed)
Conceptual Understanding by liquidity levels:
The term liquidity levels in crypto market means that there are some points where the orders are filled due to market sentiments., Although these levels plays important role in market where the traders might attract. So these areas are important because many traders might sett their stop loss and stop limit and liquidity levels hit that means so they often creates a liquidity momentum in the market and where they perform such padded their orders while the market show you the liquidity levels and the order will triggered.
You can analysis them in market easily by using the candlestick patterns strategy though the professor displayed us the pinbars and hammers candlestick patterns where the market performs such liquidity.
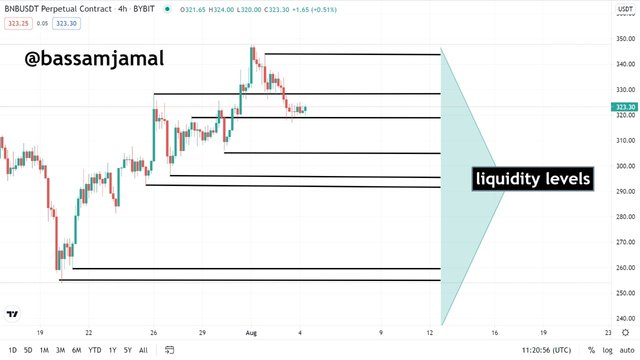
Chart formation:
The chart below is BNB/USDT where the liquidity levels are shown by highlighted arrows.
QUESTION NO: 2
2 - Explain the reasons why traders got trapped in Fakeouts. Provide at least 2 charts showing clear fakeout.
Reason of Fakeout where traders might trapped:
The trapped out is the situation where the traders stop loss and stop limit hits. The trader expected their crypto assets would give him good opportunity but ultimately the trapped areas hit them so hard that their portfolio get into massive loss. The fakeout is also very rare in unstable coins, like they are not independent and shows high liquidity though get great loss. Lets enlightened some bullet point why traders suffer these losses;
The main thing trader ain't learn the market strategy correctly not aware of any sort of technical and fundamental analysis juts hears from someone and take trades might working only on his sentiments thus the liquidity in the market always hits them.
The trader should use perfect strategy regarding resistance and support these strategies would definitely helps them and those analysis which we learn in previous sessions. (brb and msb)
The traders in the fast moving volatility of market liquidity levels often creates hope in traders mind that price will move again in the desired direction but the buffering from the market seem after the liquidity which ultimately liquidate the traders.
The financial institutions are their who creates such fakeouts to triggered the stop loss and stop limit because they are responsible for injecting and withdrawal of money in market thus the losses are in novices hands. So learn the strategy clearly and also do aware of the pros cons of these liquidity because management will works according when you know the fors and against of that thing here liquidity levels means.
Chart :1 Fakeout and its trapped BNB/USDT
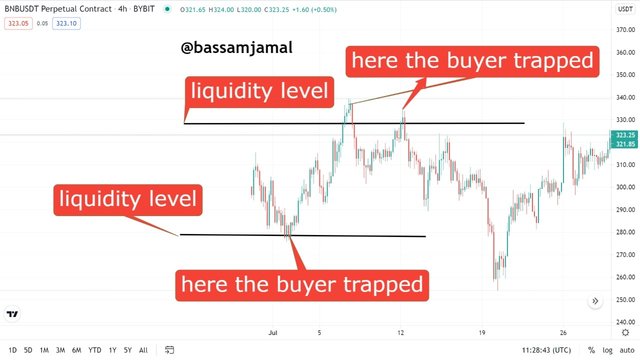
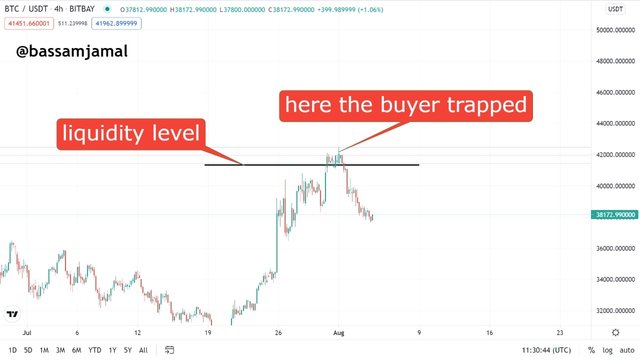
Chart :2 Fakeout and its trapped BTC/USDT
QUESTION NO: 3
3 - How you can trade the Liquidity Levels the right way? Write the trade criteria for Liquidity Levels Trading (Clear Charts Needed)
Here we will understand the position where the trade won't trapped in liquidity levels these criteria is explained by the professor also and one more strategy i will deploy lets see how they can create positive instance for us take take quality trades.
The main thing which us the strategy of brb and msb which the professor thoroughly deploys in last lectures. Hope you might be aware of that I also first examine them and ready to create positive way to trade with liquidity traps.
So if you explore the market while using with MSB BRB and RSI plus MACD you won't be in trapped. Although rsi and macd won't let you out juts give the path and for designing if that path will shown by MSB and BRB. These are the levels where the price reverse and new trend might arrives because if their bounce and pull backs.
Msb will give you the trend reversal patterns and BRB will guide you th e market continuation areas. Make them differentiate from each other. Follow the setups correctly will definitely provides you the positive positions in market.
While taking trades from BRB the proper trend continuation will be observe and if RSI mixed with it will surely give you maximum guide because the the pull backs and rsi too shows you the proper continuation in market. Whilst the MSB setup provides you the affirm trend reversal then take your according to them for gain the constructive opportunity from market.
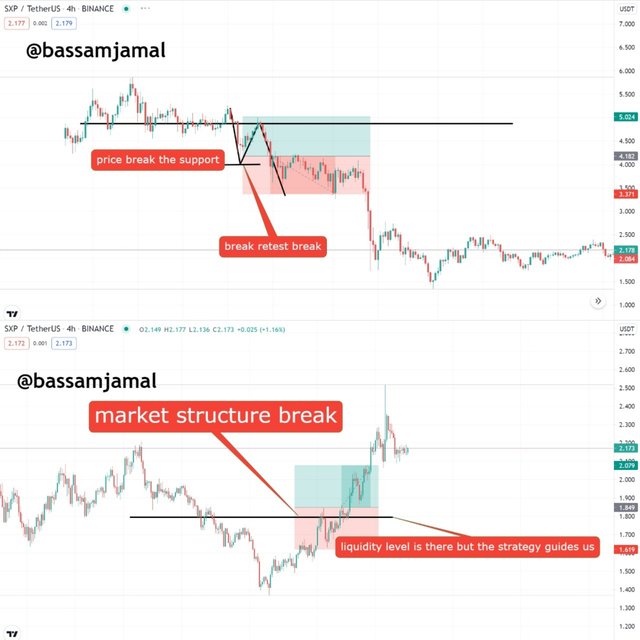
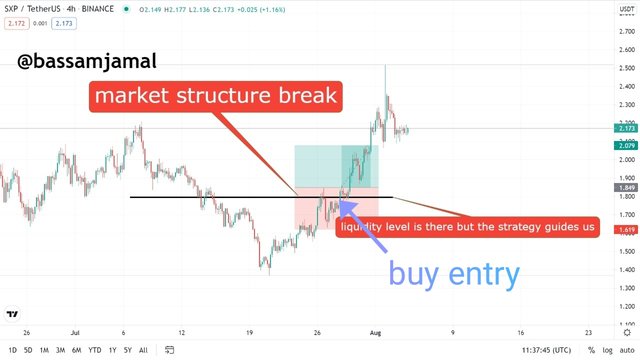
Chart Formation:
The chart below is SXP/USDT time frame is 4 hours for maximum candles though this will show you the good trading opportunities with msb and brb.
QUESTION NO: 4
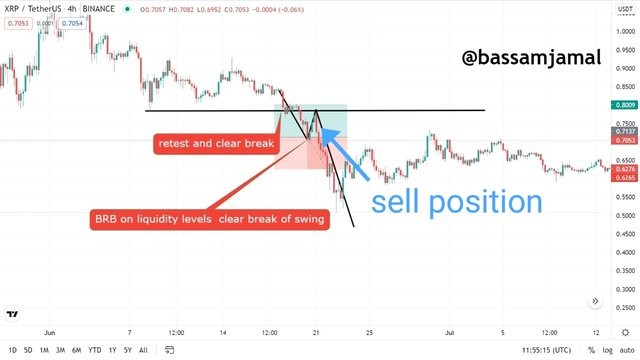
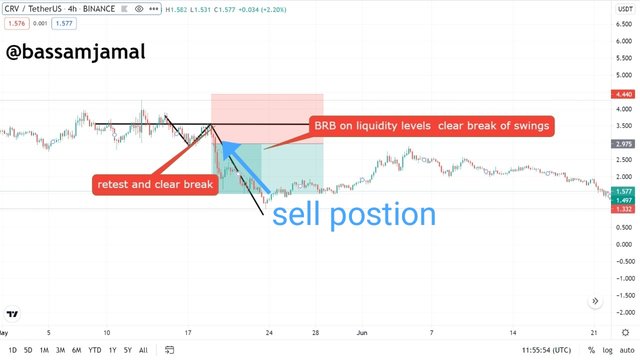
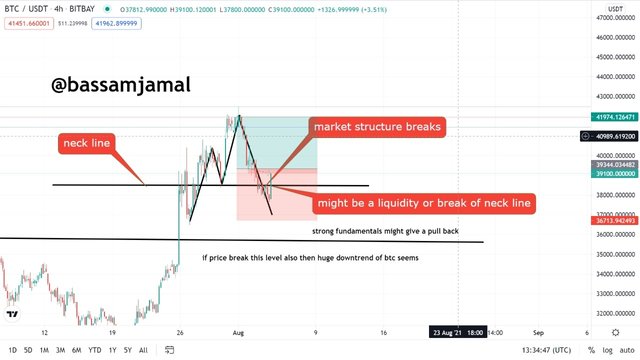
4 - Draw Liquidity levels trade setups on four Crypto Assets (Clear Charts Needed)
The chart analysis will be done according to the criteria provided in question, so i will choose XRP, CRV, TRX, BTC
Conclusion:
The strategy illustrated were so so finest that build our confidence regarding trading and how to avoid from liquidity levels.
By understanding this strategy also revised you the brb and msb strategy because it has plays a vital role in trading. Though I also do understand first the brb and msb strategies eill help me out in this lecture.
Thanks professor @cryptokraze for providing us so knowledgeable and effective lesson. Hop my homework task satisfies you.
Cc;
@bassamjamal
#cryptokraze-s3week6 #cryptoacademy #steemexclusive #price-action #liquidity #level