SEC S18-W5 || Mastering Trading with Stochastics and Parabolic SAR
The likes of one Trading in the dynamic financial markets can always seem too overwhelming, most especially here with so many of the indicators and as well the strategies available.
- But However, by well focusing probably on a few most powerful tools, there you can so much significantly enhance your pretty trading decisions magnificently. The Two such tools are indeed the *"Stochastic Oscillator and the Parabolic SAR". So dear Let’s all dive well into these very indicators, properly understand their unique components, and definitely see how combining them well can create a profound robust trading strategy for us.
Explain the components of the Stochastic Oscillator. How does it help in identifying overbought and oversold conditions in the market?
The one indicator named Stochastic Oscillator is perfectly a magnificent momentum indicator that really helps the traders to constantly identify potential reversals in the market trends by well comparing a unique and specific closing price to a range of the prices over a certain period of time.
Components of the Stochastic Oscillator
1. %K Line: This is definitely the main very line of the oscillator and so is typically well displayed as a solid line on the chart graph. It helps to represents the pretty current closing price in the relation to the very high and the low prices over a specified period, most usually 14 days.
2. %D Line: This here is a very smoothed version of the amazing %K line, of course usually a 3-day simple moving averages of %K. It then often well displayed as a perfect dotted line and also acts as a signal line for buy and the sell signals as well.
Identifying Overbought and Oversold Conditions |
|---|
Overbought: When here the dynamic Stochastic Oscillator value is rated above 80, there the very asset is considered to be "overbought", definitely meaning it really has been bought so excessively and as well might be due for a pleasing price correction or the pullback.
Oversold: And again here When the value is definitely rated below 20, then that asset is really considered "oversold", well indicating it has so been sold massive and excessively and also might be due for a price increase anytime.
By a trader recognizing these unique conditions, then they can really anticipate a potential reversals and also make informed trading decisions that's best.
Describe the Parabolic SAR indicator and its application in identifying the trend direction. How is it interpreted differently in an uptrend compared to a downtrend?
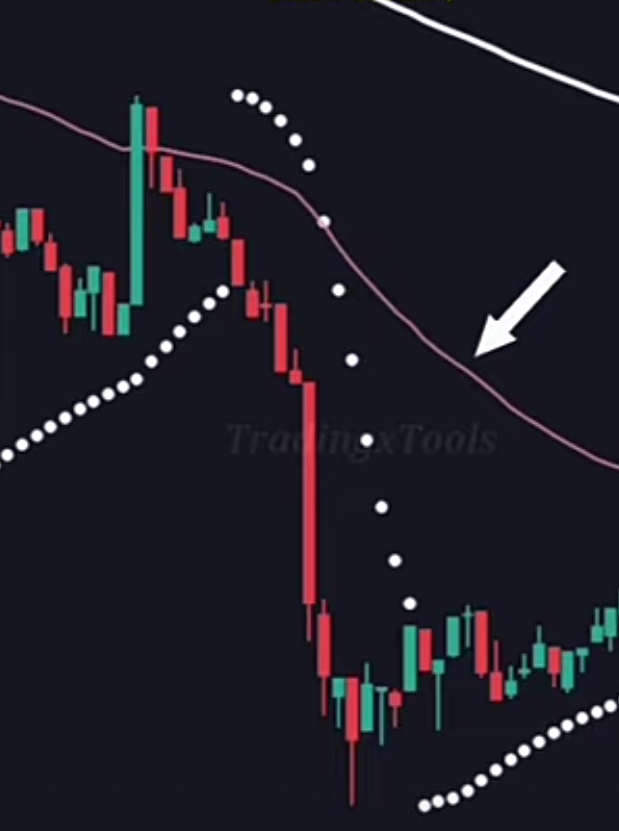
The one called Parabolic Stop and Reverse (SAR) is a unique trend-following indicator that always helps traders to really determine the kind and perfect direction of an asset's movement and also a potential reversal points definitely. It so appears as a kind of series of the dots placed either really above or below the price candles on a chart graph.
Application of Parabolic SAR
Uptrend: When here the dots are just below the price candles, it massively indicates to all an upward trend. The Traders do often look for buying opportunities in this very scenario.
Downtrend: When also the dots are just above the very price candles, it greatly signifies a downward trend here. Then the Traders as well may consider selling or maybe shorting opportunities here.
The Parabolic SAR is indeed a very unique one because it definitely not only helps like identify the trend direction but here it also provides a more potential stop-loss levels, soundly making it a handy tool for a perfect managing risk.
How can the combination of the Stochastic Oscillator and Parabolic SAR be used to create a robust trading strategy? Provide a detailed explanation.
When used together properly, the two indicators! Stochastic Oscillator and Parabolic SAR can magnificently provide all a unique powerful signals for properly entering and exiting trades anytime.
so Here we have how you can combine them well:
1. Confirming Trends: Use here the amazing Parabolic SAR to genuinely identify the very current trend direction. If though the dots are maybe below the price, definitely the market is in an uptrend; but if above, it’s signifies a downtrend.
2. Identifying Entry Points: Use here too the unique Stochastic Oscillator to really find the "overbought and oversold" conditions well.
Where In an uptrend, look well for the oversold conditions (Stochastic below 20) to really identify potential buying opportunities well.
In a downtrend as well, look too for the overbought conditions (Stochastic above 80) for any potential selling opportunities.
3. Executing Trades: Definitely Once you identify a trend and also an overbought/oversold condition properly, try execute the trade. Like For example, if there the Parabolic SAR really indicates maybe an uptrend and as well the Stochastic Oscillator shows too the oversold, it so might be a good time to really buy.
4. Managing Risk: Use here the Parabolic SAR dots as the stop-loss levels to significantly protect your trades. If though the trend do reverses, the SAR dots will definitely switch sides, signaling here an exit from the trade entirely.
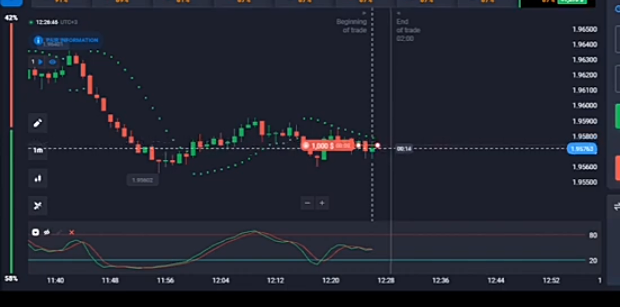
Historical Trading Scenario: STEEM/USDT Pair
Let’s all try analyze a dynamic past trading scenario with the amazing STEEM/USDT pair to definitely illustrate how these indicators really work together.
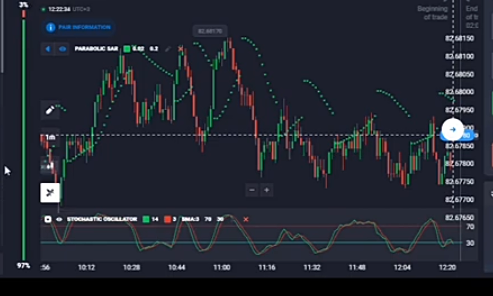
In well observing the STEEM/USDT chart then You'll notice the following:
- The Parabolic SAR dots are really below the price candles, indicating an uptrend here.
- The Stochastic Oscillator as well here shows a value below 20, therefore indicating an oversold condition as well.
In this very situation or any of this kind, the indicators really suggest that though despite the ongoing uptrend, these very asset has been really sold excessively and as well might be due for a price increase soon. But Based on this dynamic analysis, you there could decide to maybe enter a buy position, as much expecting the price to rise. You then really needs to and would set your stop-loss below the very current level of the Parabolic SAR dots to help manage your risk 🙏.
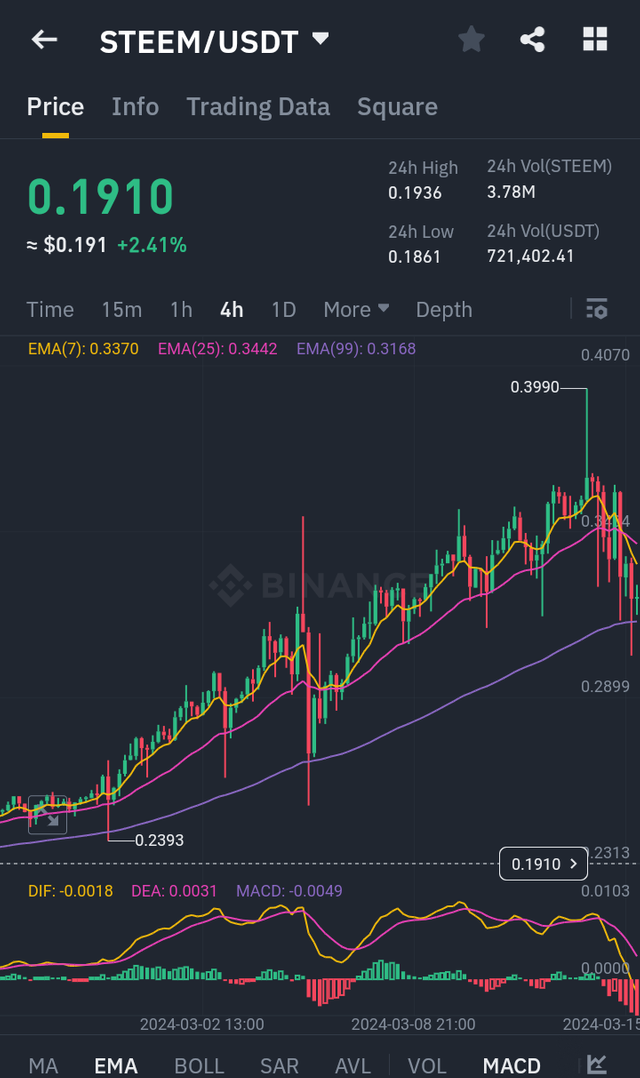
Current Technical Analysis: STEEM/USDT Pair
To greatly perform a technical analysis on our dear current STEEM/USDT pair using here both the Stochastic Oscillator and Parabolic SAR, these steps are profoundly regarded:
Examine the Parabolic SAR: Look well at the very current placement of the SAR dots properly. If then they are below that price candles, there you have it that the market is in an uptrend. If above, it’s really suggest a downtrend.
Check the Stochastic Oscillator: Note as much too the current value. If definitely the Stochastic is above 80, the asset is really known to be overbought; if below 20, it’s regards oversold.
Let’s say we did observe the following properly:
- The very Parabolic SAR dots are seen below the price, therefore indicating an uptrend.
- The Stochastic Oscillator is close too well to the oversold region but not quite there exactly.
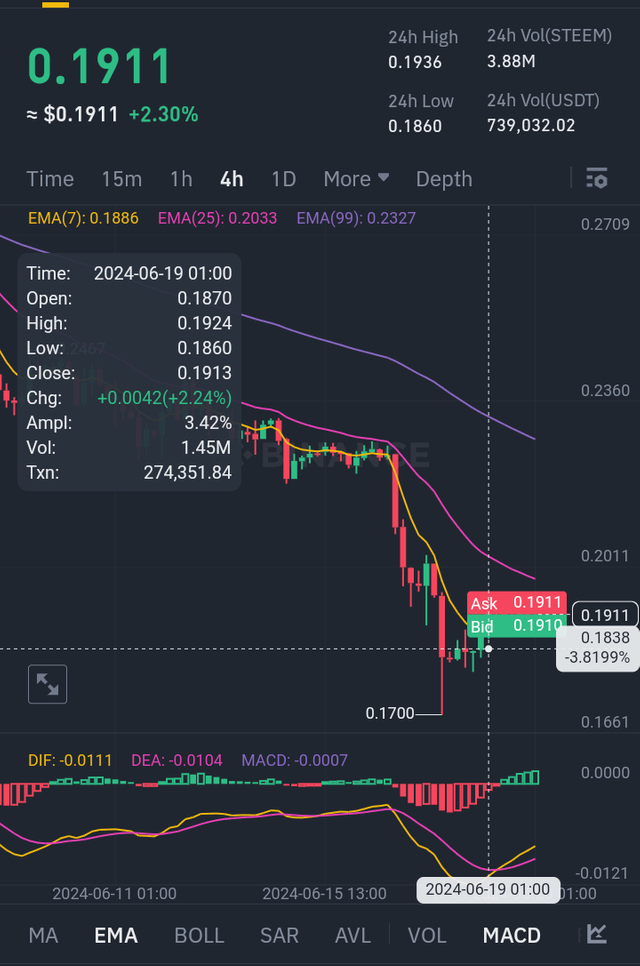
Trading Recommendation |
|---|
"Based on the dynamic analysis:"
The very uptrend indicated always by the Parabolic SAR always suggests in looking for buying opportunities anytime.
Although too the Stochastic is not yet in the oversold territory as maybe expected, it’s close, there hinting at a potential buying opportunity soon.
Really Given this setup, it indeed might be very much wise to wait for the Stochastic to really drop below 20 to help confirm well the oversold condition before then rushing on entering a buy position. You there can use the Parabolic SAR dots to really set your stop-loss and also politely protect your trade in case the trend reverses by massive influence.
Conclusion |
|---|
Steemians! Trading well with the Stochastic Oscillator and Parabolic SAR can really enhance our dear decision-making process by always providing us with clear signals for entry and also exit points. The unique Stochastic Oscillator always helps to identify "overbought and the oversold" conditions, while too the Parabolic SAR genuinely highlights the trend direction and also the potential reversal points which may occur.
- I admit that by well combining these amazing indicators, we can perfectly develop a pretty robust trading strategy that will definitely balances potential gains with much effective risk management properly. So Whether you’re really analyzing the historical data or probably the current market conditions, these unifying tools can really help guide you towards a more informed and really confident trading decisions in the experiences.
I'm inviting @bossj23, @sahmie and @kidi40 to please join me let's learn together and really understand the concept.
connect me on Steemit
"Thank you So much for Reading"
Upvoted. Thank You for sending some of your rewards to @null. It will make Steem stronger.
My X link;
https://twitter.com/EmediongEtok/status/1803586659700605249?s=19
You made helpfull post especially detailed about overbought and oversold conditions. Your details can help traders to improve their trading skills.
TEAM 5
Of course for a buyer and seller these two integrators are very important market exit and entry for you. You are correct. Although these two indicators are very easy to use, surely more people can learn from your post. Best of luck to you.
How can we miss an opportunity that will give us significant profits in a short time. Yes, that's the great thing about indicators and these two indicators are very popular in the world of trading.
We can see that everyone does not want to be wrong in analyzing the direction of market movements, and is waiting for the point where we can open and close orders properly and correctly.
Trend reversals should also be monitored and I agree with you that we should be polite in closing orders during sudden trend reversals.