SEC S18-W4 || Mastering Liquidity Levels in Trading
First let me please Welcome everyone to an in-depth guide on properly mastering of the liquidity levels in the trading! aspect. So Whether here you're either a beginner or probably turn to an experienced trader already, but well understanding of the liquidity levels can effectively be a game-changer for your trading strategy entirely and better.
- Then In this guide here, I will do well to walk you all properly through the uniq6 concept of the liquidity levels, their unique and dynamic importance, as well the common pitfalls in likes of fakeouts, and effective strategies to properly leverage well all these levels for a better and successful trading. Steemians Let's do well to dive in!

Describe the concept of liquidity levels in trading. Why are they important for traders? What indicators or tools are used to identify these levels on a price chart?
What Are Liquidity Levels? |
|---|
Many people do wander around here but, Liquidity levels practically refers to the price zones in a or any market where indeed a significant number of the buy and sell orders are really really clustered. These unique levels maybe or often times act as either a support or resistance points on a pretty price chart. - Therefore In simple terms, the liquidity levels are indeed areas here where many of the traders are really interested in them buying or selling an asset, this leading to a massive increased trading activity as well.
Let's all Imagine you're definitely at a busy marketplace, assume you find yourselves there. There are indeed many or certain spots where promptly most people gather, or perhaps near popular stalls or the entry points. so Similarly too in trading, the liquidity levels are definitely acknowledge as those busy spots on the dynamic price chart where lots of the trades do happen.
Why Are Liquidity Levels Important for Traders?
The Liquidity levels terms are very crucial for some several reasons here:
1.Price Stability: A High liquidity generally here means very well that there are certainly enough buyers and also sellers to keep the pretty price stable. This kind of stability can definitely be advantageous for the traders looking well to enter or probably exit the positions without them causing significant price fluctuations at all.
2.Opportunity Zones: These very levels here often times act as what I'll acknowledge as a psychological barriers where definitely the price might reverse or the experience increased in volatility. so well Identifying these zones can definitely help the traders to try anticipate potential market movements very well.
3.Risk Management: As a Trader Knowing fully well where these very levels are can indeed help all involve to set better stop-loss orders and as well manage their very risk more and more effectively.
Indicators and Tools to Identify Liquidity Levels |
|---|
To any willing to identify liquidity levels on a certain price chart, the traders should use these various indicators and tools;
1.Volume Profile: This very dynamic tool helps well to shows the amount of the trading activity at a different price levels pretty perfect over a specific period. It definitely enhances helps on identifying where the most trading has occurred, well indicating potential liquidity levels as well.
2.Order Book Analysis: By all properly analyzing the very term called 'order book', then the traders can see significantly where a large buy and sell orders are really placed. The Clusters of these orders often times indicate a very strong liquidity levels definitely.
3.Support and Resistance Lines: These indeed are the basic but yet very much powerful tools. In one Drawing horizontal lines at the price points where the very asset has probably or previously reversed or maybe stalled can help well in identifying liquidity levels.
4.Candlestick Patterns: A Certain candlestick patterns here, in likes of "Doji or Hammer", can very much signal the unique potential liquidity zones when they really appear at key support maybe at resistance levels.
What is a fakeout in the context of liquidity levels? Explain why and how traders are often trapped by fakeouts.
What Is a Fakeout? |
|---|
A fakeout always occurs directly when the very price briefly moves here beyond a precise liquidity level (support or resistance) but will always do the reverses direction, so much trapping traders who did entered positions expecting maybe a breakout.
let's do well Imagine you're definitely at that busy marketplace again here. And a sudden rush maybe towards a particular stall might consequently make you think something really special is will or happening there, but there it did turns out to be a false alarm.
Why and How Traders Are Trapped by Fakeouts
Many of our Traders are so often fall in here for fakeouts due to maybe the following reasons:
1.Overreliance on Breakouts: Though Many traders do assume that definitely when the price do breaks a significant level at times, it so will continue in same or that direction. But However, the market makers and too the large players otherwise might push the price beyond these very levels to duly trigger the stop-loss orders before reversing it back.
2. Lack of Confirmation: Sometimes Jumping here into a trade maybe without properly waiting for a better confirmation of the breakout can so lead to getting caught in a fakeout like this.
3. Emotional Trading: Either the Fear of missing out (FOMO) can so drive traders here to enter trades so prematurely without a pretty and proper analysis.
Describe an effective strategy for trading liquidity levels correctly. What signs or confirmations should traders look for before taking a position based on a liquidity level?
To really really trade liquidity levels More successfully, please it's adviceable to consider these very steps:
1.Identify the Liquidity Levels: Please do well to Use the tools and indicators definitely mentioned earlier to help pinpoint key liquidity zones on your price chart better and proper.
2.Wait for Confirmation: As a Trader, Before one entering a trade at all, try wait for a unique confirmation that the price is so respecting the liquidity level well. This definitely could be in the form of either a "candlestick pattern, volume spike, or maybe a retest of the level."
3.Set Clear Entry and Exit Points: Do well to try Determine your pretty entry point, the stop-loss, and as well the take-profit levels properly before placing the trade you are willing to. This do helps in well managing the risk and pretty ensuring you have a nice and clear plan.
4.Monitor Volume: A very High volume during any of the price interaction with a pretty liquidity level can so much help indicate a genuine interest and too a potential continuation. so a Low volume might suggest either a fakeout.
Signs and Confirmations to Look For |
|---|
- Candlestick Patterns: Do well to Look for patterns like maybe the engulfing candles, pin bars, or hammer candles at the very liquidity level here. These very patterns can do well indicate a much more potential reversals or as well continuations.
- Volume Spikes: An increase here in a trading volume at the expense of liquidity level help suggests a strong participation and so can pretty confirm the level's validity massively.
- Retest of Level: Often times, after maybe breaking a very liquidity level, the dear price will retest it. so If the level holds during the retest, it then can be a strong confirmation to definitely enter a trade.
What are some tips and techniques to avoid fakeouts when using a trading strategy based on liquidity levels? Give a concrete example with detailed steps.
As a trader either a beginner 🔰 or an expert, To avoid fakeouts please do well to consider the following tips and techniques here:
1.Use Multiple Time Frames: In Analyzing the liquidity levels definitely across different time frames can perfectly provide a well and more comprehensive view. So For instance, a pretty level that really appears significant on a daily chart here might so be less important on an hourly chart 📉.
2. Combine Indicators: Please Relying on the multiple indicators can definitely help all reduce the chances of always falling for fakeouts. For example, the combining of volume profile analysis Join with candlestick patterns and as well a moving averages can help well to provide stronger signals.
3. Stay Patient: In everything, Patience is indeed much paramount and crucial in the trading techniques. Much Waiting for a best and perfect confirmation and as well not jumping into trades impulsively can help save you from many takeouts that will come.
4.Use Smaller Position Sizes:
Please Guys When trading around the liquidity levels, do well to consider using a smaller position sizes to try mitigate the amazing impact of potential fakeouts.
Concrete Example with Detailed Steps |
|---|
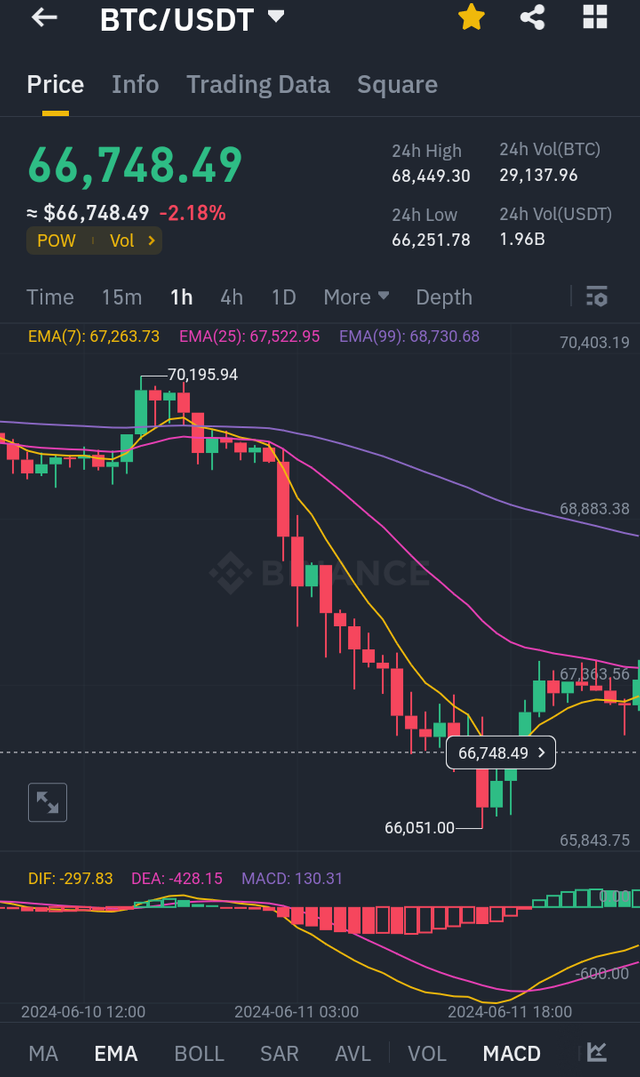
Let's all try to consider a concrete example by using a very popular crypto asset like the Bitcoin:
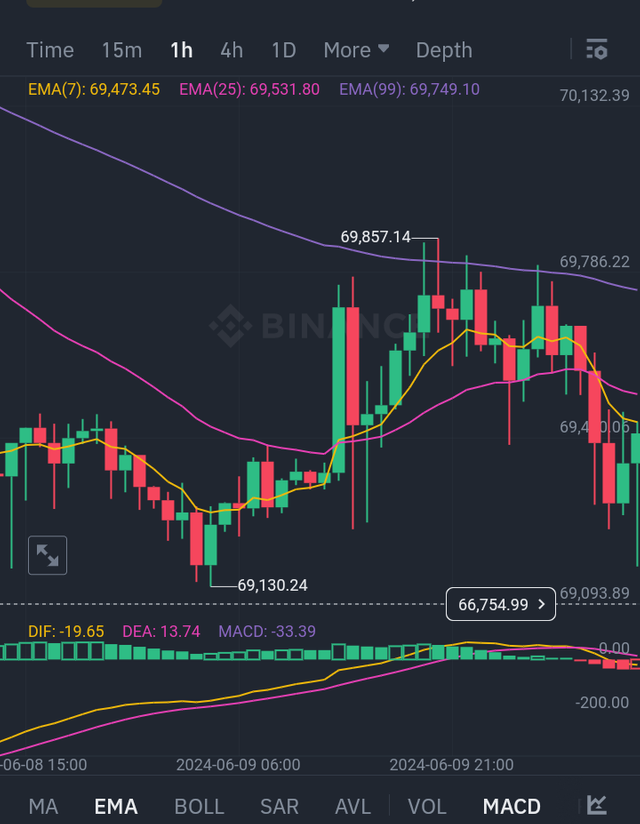
1. Identify a Key Liquidity Level: It's obvious Bitcoin has a strong support level at $68,000, identified well through historical price action and as well a high trading volume.
2.Wait for Confirmation: The very price approaches the $70,000, and then you notice a perfect bullish engulfing candle forming here along with a volume spike. This verily indicates a potential buying interest.
3.Set Entry and Exit Points: Do Plans to enter the very trade at $69,500 with a pretty stop-loss at $68,500 ( just below the support level) and then a take-profit at $72,000 the (previous resistance level).
 |  |
|---|
4.Monitor the Trade: The dead price hits $69,500, and you enter the trade very well. Do well to Monitor for any signs of any reversal or maybe a continuation, like the additional bullish candles or sustained high volume.
5.Adjust as Needed: If then the price really breaks below $68,700 and your stop-loss is definitely hit, exit these very trade and do reassess the situation. If it then moves towards $72,000, then definitely consider locking in profits or maybe adjusting your stop-loss to really protect the gains.
Analyze a chart of a crypto asset of your choice, including the Steem token, to identify liquidity levels. Describe a potential trade based on these levels by explaining your reasoning and the steps you would take to enter and exit the position.
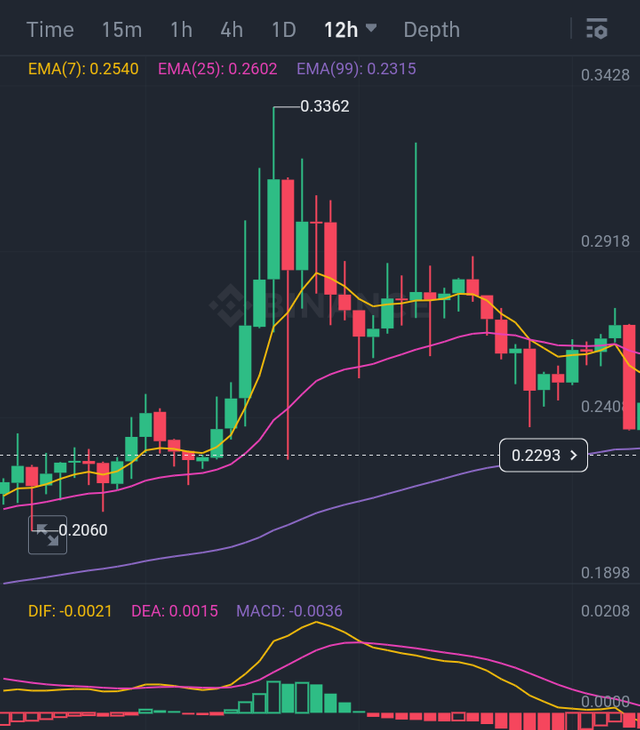
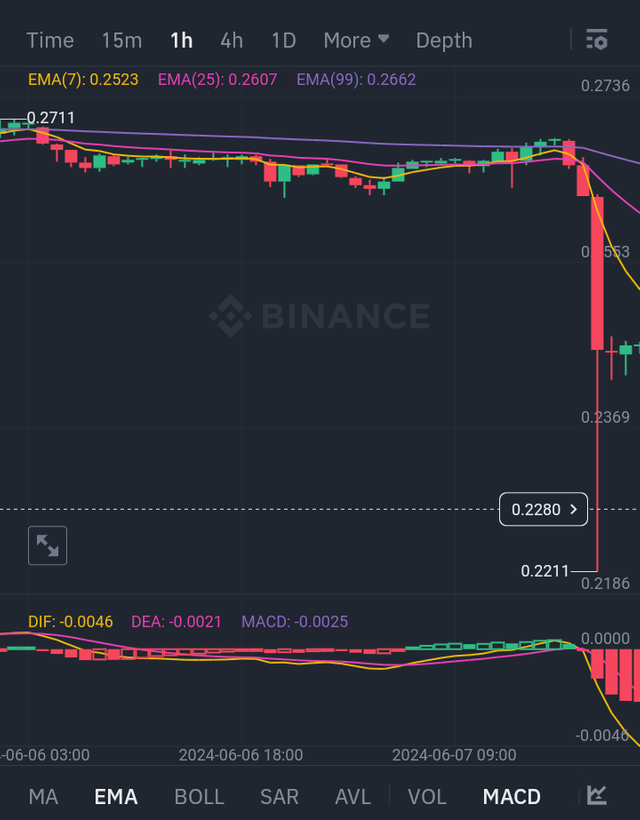
Let's all here in one voice analyze a chart of the Steem token to pretty identify liquidity levels and also plan a potential trade:
- Identify Key Liquidity Levels:
- Support Level: $0.21
- Resistance Level: $0.30
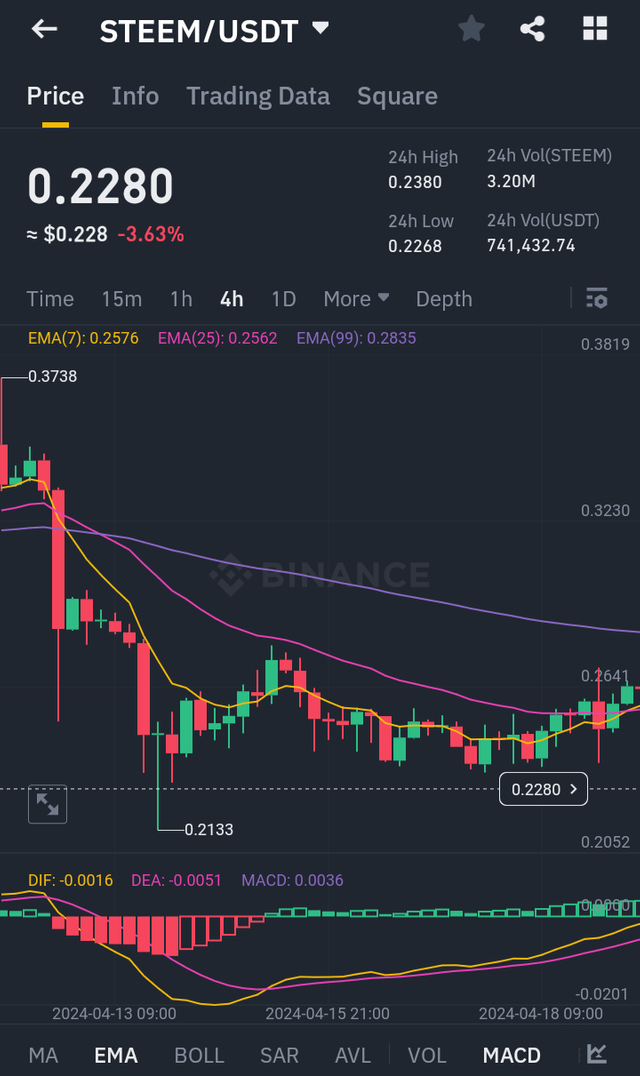
These very levels are so identified based on historical price action where the price has so repeatedly bounced off or reversed again.
Observe Price Action:
- The very price approaches the amount$0.21
support level. - Then You notice a perfect hammer candle forming at $0.21, along too with an increased volume. This definitely suggests a potential reversal.
- The very price approaches the amount$0.21
Set Up the Trade:
- The Entry Point: $0.22 (above the hammer candle high as the case maybe)
- Stop-Loss: $0.19 (just below the support level here)
- The Take-Profit: $0.30 (below the resistance level as well)
Execute and Monitor:
- Do well to Enter the trade at $0.22.
- Please Monitor for any of the signs of maybe a potential fakeout, such as a sudden price drop or definitely a low volume.
- Adjust Accordingly:
- If then the price moves as all expected towards $0.30, please consider moving your dear stop-loss to a breakeven to ao protect your position well.
- If as the case maybe the price breaks just below $0.19, please exit the trade and then reassess.
By well following these unique and dynamic steps, definitely you can effectively trade the liquidity levels and so much improve your chances of success while also minimizing the very risk of falling for any "potential fakeouts".
Conclusion |
|---|
As much as a trader, Mastering of the liquidity levels in a trading really involves one definitely understanding their importance, as well recognizing potential fakeouts, and then verily implementing effective and better strategies to trade them well.
- By well combining in a much and dynamic technical analysis tools, as much waiting for better and best confirmations, and then managing risk appropriately, the traders here can really enhance their trading performance effectively.
Please Remember, 🙏 patience and of course discipline are indeed acknowledge as the key to navigating the complexities of any liquidity levels. Happy trading! all
I'm inviting @nsijoro, @bossj23 and @kidi40 to accept my invitation let's learn together as family.
connect me on Steemit
"Thanks Steemians for Reading"
Upvoted. Thank You for sending some of your rewards to @null. It will make Steem stronger.
my Twitter link
https://twitter.com/EmediongEtok/status/1801399739394482543?t=pl5N2DzwXBAPZCHTtYclgw&s=19
@basil20 This guide on mastering liquidity levels in trading is extremely insightful! Understanding where traders place their buy and sell orders can really improve trading strategies. The explanations on identifying liquidity zones avoiding fakeouts and effective trading strategies are very helpful. Pairing liquidity levels with supply and demand zones is a smart approach that can benefit both beginners and experienced traders. Thanks for sharing such valuable information. Good luck with the contest
I'm pleased this was quite impactful
Hello dear @basil20 ..
I read your post you can explain these two points Liquidity levels and trading very nicely I can learn from your post. I have also participated in it because it's interesting contest
Best of luck for contest 💞
I'm really really grateful 🙏
Nice one. Patience is most important in trading. When price around liquidity levels the traders should have patience till signal confirm the next movement. Thank you.
very sure.
thank you sir
TEAM 7
Congratulations! Your post has been upvoted through steemcurator09.This is awesome! Your analogy of liquidity levels to busy market spots is super relatable. It makes understanding trading so much easier!
Greetings @basil20,
You've got a solid grasp of how liquidity, fakeouts, and trading strategies tied to liquidity levels work. Your explanations are spot-on and practical, especially with the real-life examples and helpful advice you provide for traders. It's awesome how you break down these concepts in a way that's easy to understand and apply in the trading world. Keep up the excellent work.