SEC S18-W2 || Mastery of Moving Averages and Fibonacci Retracements
In the amazing world of the trading, there are indeed several of the tools and amazing strategies that traders use to really make informed decisions well.
- Two of the very most popular tools are undoubtedly the "moving averages and Fibonacci retracements"".
By well Mastery of these can so significantly enhance a trader’s unique ability to predict the market movements and also make profitable trades out of it. This very guide will really explore the different types of moving averages, their amazing applications, and as well how Fibonacci retracements can indeed be used in conjunction with moving averages to perfectly develop a robust trading strategy all round.

What is the Difference Between a Simple Moving Average (SMA) and an Exponential Moving Average (EMA)?
The Moving averages are definitely the fundamental tools in the technical analysis really used to smooth out the price data and also identify trends. The very two most commonly used moving averages here are the Simple Moving Average (SMA) and the Exponential Moving Average (EMA).

Simple Moving Average (SMA)
In the Simple Moving Average it's the average of a very selected range of prices, as much typically closing prices, over a specified period. For example here, to really well calculate a 10-day SMA, you really and so much add up the closing prices of the last 10 days and then divide by 10. This very average moves as each new day’s price becomes certainly available, hence come the term "moving average."
Calculation of SMA:
[ \text{SMA} = \frac{\sum_{i=1}^{n} P_i}{n} ]
Where here:
- ( P_i ) = Price at day ( i )
- ( n ) = Number of periods
Typical Use in Trading: SMAs indeed are used to help identify the unique direction of the current trend 📉. A pretty rising SMA widely suggests an uptrend 📈, while a falling SMA definitely indicates a downtrend 📉.
The Traders so often look for crossovers, where a very short-term SMA crosses above or probably below a long-term SMA, as a potential buy or sell signals.
Exponential Moving Average (EMA)
The "Exponential Moving Average" here gives more weight to the recent prices, making it much more responsive to a new information so compared to the SMA. This is so particularly useful in a volatile markets where traders need to react very quickly.
Calculation of EMA:
[ \text{EMA} = \text{Price}{\text{today}} \times \alpha + \text{EMA}{\text{yesterday}} \times (1 - \alpha) ]
Where here we have:
- ( \alpha ) = Smoothing factor, ( \alpha = \frac{2}{n+1} )
- ( n ) = Number of periods
Typical Use in Trading: EMAs are indeed favored for their unique and sensitivity to price changes. They are indeed commonly used to help signal entry and exit points properly. For example, when the very price crosses above the "EMA" , it so can be seen as a buy signal to trade, and again when it crosses below, it definitely can be a sell signal.
Golden Cross and Death Cross
In the very context of moving averages here, we have two significant patterns that traders look for, which are the Golden Cross and the Death Cross.
Golden Cross
A "Golden Cross" duly occurs when a pretty short-term moving average (like the 50-day SMA) so crosses above a long-term moving average (like the 200-day SMA).
- This is so well generally interpreted as a bullish signal, well indicating that the price is so much likely to continue to rise.
How it Influences Trading Decisions: When Amy traders observe a dynamic Golden Cross, they do often see it as a strong buy signal to trade. This so well can lead to increased buying activity and as well a further rise in price due to the bullish sentiment pointed.

Death Cross
A "Death Cross" is definitely the opposite of a Golden Cross. It do occurs when a short-term moving average crosses not any where but below a long-term moving average. This here is typically seen as a bearish signal, suggesting well that the price may continue to decline.
How it Influences Trading Decisions: A Death Cross seen can prompt any traders to practically sell their positions or definitely avoid buying, as it do indicates potential for further downward movement. This very bearish sentiment can then lead to increased selling pressure massively.
Using Fibonacci Retracements to Determine Support and Resistance Levels
"Fibonacci retracements" are prominently a popular tool well used to identify some potential support and the resistance levels. These very levels are really based on the Fibonacci sequence, a unique series of the numbers where by each number is the sum of the very two preceding ones. The Key Fibonacci levels used in the trading include* 23.6%, 38.2%, 50%, 61.8%, and 100%.
Real-life Example: Let's definitely use a recent example from the dear stock market. Imagine a pretty stock that has risen from $100 to $150. Using the Fibonacci retracement, you indeed would calculate the potential support levels as follows here:
- 23.6% retracement: ( 150 - (0.236 \times (150-100)) = 150 - 11.8 = 138.2 )
- 38.2% retracement: ( 150 - (0.382 \times (150-100)) = 150 - 19.1 = 130.9 )
- 50% retracement: ( 150 - (0.5 \times (150-100)) = 150 - 25 = 125 )
- 61.8% retracement: ( 150 - (0.618 \times (150-100)) = 150 - 30.9 = 119.1 )
I admit all Traders would watch these levels for some signs of support (where definitely the price might stop falling and definitely start rising again) or the resistance (where the very price might stop rising and of course start falling).

Designing a Trading Strategy Using Both EMA and Fibonacci Retracements
To really create a trading strategy that well uses both EMAs and Fibonacci retracements, please follow these steps:
Step 1: Identify the Trend
Use the EMAs to properly determine the current trend. For example, a 50-day EMA crossing here above a 200-day EMA signals an uptrend massively.
Step 2: Apply Fibonacci Retracement Levels
In an uptrend here, try identify a recent significant price move (from probably a swing low to a swing high). Then Plot the Fibonacci retracement levels to help identify potential support levels.
Step 3: Entry Points
In here, Look for the price to really pull back to one of the key Fibonacci levels (38.2%, 50%, or 61.8%). At the very same time, check too if the price is near the 50-day or 200-day EMA.
- If the very price shows some signs of bouncing off these levels, it could then be a good entry point.
Step 4: Exit Points
Set too exit points at the next Fibonacci retracement level above your very entry point. For example, if you really enter at the 50% retracement, consider in exiting at the 38.2% level.
Step 5: Risk Management
It adviseable to Always set a stop-loss orders just below the next Fibonacci level and definitely below your entry. For instance here, if you enter at the very 50% retracement, then place your stop-loss just below the 61.8% level. This definitely helps limit potential losses if the very trade goes against you.
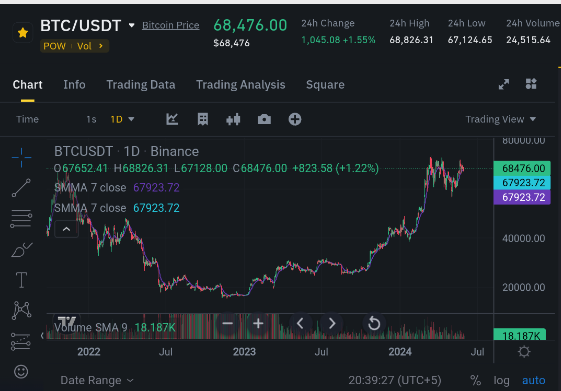
Historical Trading Chart of STEEM/USDT Pair
Let’s so well analyze a historical trading scenario for the STEEM/USDT pair where indeed a Golden Cross was followed by a significant price movement, enhanced properly by applying Fibonacci retracements.
Step 1: Identify the Golden Cross
Well Imagine a scenario where the very 50-day EMA crosses above here the 200-day EMA on the STEEM/USDT chart. This is indeed our Golden Cross, indicating a quality potential bullish trend.
Step 2: Plot Fibonacci Retracements
After the very Golden Cross, assume STEEM rises from $0.50 to $1.00. We then plot Fibonacci retracement levels from this very swing low to a swing high.
- 23.6% retracement: ( 1.00 - (0.236 \times (1.00-0.50)) = 1.00 - 0.118 = 0.882 )
- 38.2% retracement: ( 1.00 - (0.382 \times (1.00-0.50)) = 1.00 - 0.191 = 0.809 )
- 50% retracement: ( 1.00 - (0.5 \times (1.00-0.50)) = 1.00 - 0.25 = 0.75 )
- 61.8% retracement: ( 1.00 - (0.618 \times (1.00-0.50)) = 1.00 - 0.309 = 0.691 )
Step 3: Entry Point
Let's Assume the very price retraces to the 38.2% level ($0.809) and then finds support there, close to the 50-day EMA. This very alignment of the support from Fibonacci and the EMA provides a very strong buy signal firmly.
Step 4: Exit Point
Target properly the previous high at $1.00 or definitely use a trailing stop to help maximize gains as the price continues to rise.
Step 5: Risk Management
Try Place a stop-loss just perfectly below the 50% retracement level ($0.75) to help protect against any significant losses if the price falls further than expected.

Conclusion |
|---|
In Mastering the moving averages and Fibonacci retracements can so well significantly enhance any trader's dynamic ability to make well informed decisions.
The amazing SMA and EMA do provide amazing insights into the direction and as well the strength of trends, while the Fibonacci retracements help to practically identify a potential support and as well resistance levels.
- By properly combining these unique tools, a traders can well develop robust strategies for well entering and also exiting trades, managing any risk, and properly maximizing profits. So Whether you’re observing a pretty Golden Cross, a Death Cross as well, or definitely using Fibonacci levels to help find the key price points, these pleasing tools are indeed invaluable for anyone looking to really succeed in trading.
I'm inviting @patjewell, @artist01 and @nsijoro to join me lets find how well the strength of this tools can be rely on when trading.
Connect me on Steemit
:Thanks 👍 All For Reading:
Thank you, friend!


I'm @steem.history, who is steem witness.
Thank you for witnessvoting for me.
please click it!
(Go to https://steemit.com/~witnesses and type fbslo at the bottom of the page)
The weight is reduced because of the lack of Voting Power. If you vote for me as a witness, you can get my little vote.
Upvoted. Thank You for sending some of your rewards to @null. It will make Steem stronger.
My Twitter link
https://twitter.com/EmediongEtok/status/1797390674884427787?t=0Jy6wNBIkl5DwMrE0xRzgQ&s=19
Dear friend you have done really well so I know how difficult it is to come up with such amazing content. Please keep it up, to keep steemit enriched. You can also comment on my entry through the link below https://steemit.com/hive-108451/@starrchris/steemit-crypto-academy-contest-s18w2-mastery-of-moving-averages-and-fibonacci-retracements
That's true, the trading world is full of interesting tools and strategies to help traders make smart decisions. Each tool offers unique insights that can improve trading performance.
You are correct, moving averages and Fibonacci retracements are widely used by traders. They are essential for identifying trends and potential reversal points in the market.
Oh yeah, mastering these tools can greatly improve a trader's ability to forecast market moves and make profitable trades. Understanding how to use them effectively is key to successful trading.
That's right, SMA and EMA are the most popular types of moving averages. Each has its strengths and is used by traders for different purposes to analyze market trends.
Wish you all the best.
Your knack for breaking down complex trading concepts into easy-to-understand bits with real-life examples and smart tips is top-notch. Your willingness to share your wisdom and insights about the trading world is truly valuable and helps others navigate the market more effectively. Good luck...
Your post has been successfully curated by our team via @𝐢𝐫𝐚𝐰𝐚𝐧𝐝𝐞𝐝𝐲 at 35%.
Thank you for your committed efforts, we urge you to do more and keep posting high-quality content for a chance to earn valuable upvotes from our team of curators and why not be selected for an additional upvote later this week in our top selection.
MY Twitter link
https://twitter.com/EmediongEtok/status/1798346542056943787?t=jPu90yIoj4G47zhygPszMA&s=19