Crypto Academy Season 4 Beginner's Course-Task 10: Candle Stick Patterns
Introduction
Greetings to you, dear friends! I'm delighted to write to you once more about Professor @reminiscence01's amazing presentation on candlestick patterns. I'm really looking forward to attending this presentation. Keep an eye out for me as I lead you through the lecture.
1a) Explain the Japanese candlestick chart? (Original screenshot required).
b) In your own words, explain why the Japanese Candlestick chart is the most used in the financial market.
c) Describe a bullish and a bearish candle. Also, explain its anatomy. (Original screenshot required)
EXPLAIN THE JAPANESE CANDLESTICK CHART?
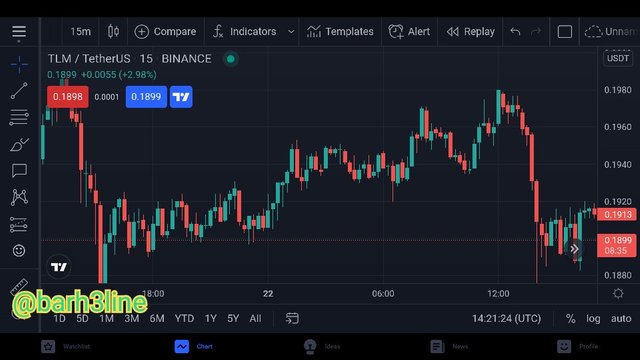
The Japanese candlestick charts are one of the most popular candlestick charts. With this chart, traders use it to make trading decisions that are based on regular occurring patterns that help forecast the very short-term direction of the price. Thus, the candlestick charts are used by traders to determine the possible price movements that are based on past patterns.
Trading as we know is often directed by emotion. This can be read in the candlestick charts. The candlestick chart is very useful in trading since they show four price points. These are: open, close, low, and high. They tend to show throughout the period of time the trader sets or specifies.
IN YOUR OWN WORDS, EXPLAIN WHY THE JAPANESE CANDLESTICK CHART IS THE MOST USED IN THE FINANCIAL MARKET
The candlestick assists us in maintaining a precise understanding of supply and demand, as well as how it influences the financial market. The Japanese candlestick is a powerful tool that helps technical analysts accurately predict the trend of the crypto market. It can help a trader determine the difference whether the market is in a bullish or bearish phase in various time frames, and as a result, technical analysts all over the world rely on candlesticks to conduct accurate detailed analyses on the financial market. Because of the fact that the candle stick helps traders provide a detailed analysis of the financial market with minimal margin for mistake, I don't think it's strange that it's one of the most extensively utilized in the financial markets.
DESCRIBE A BULLISH AND A BEARISH CANDLE. ALSO, EXPLAIN ITS ANATOMY.
BULLISH CANDLESTICKS
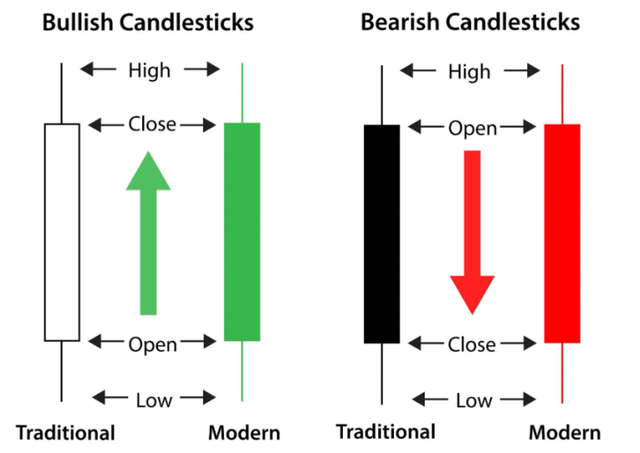
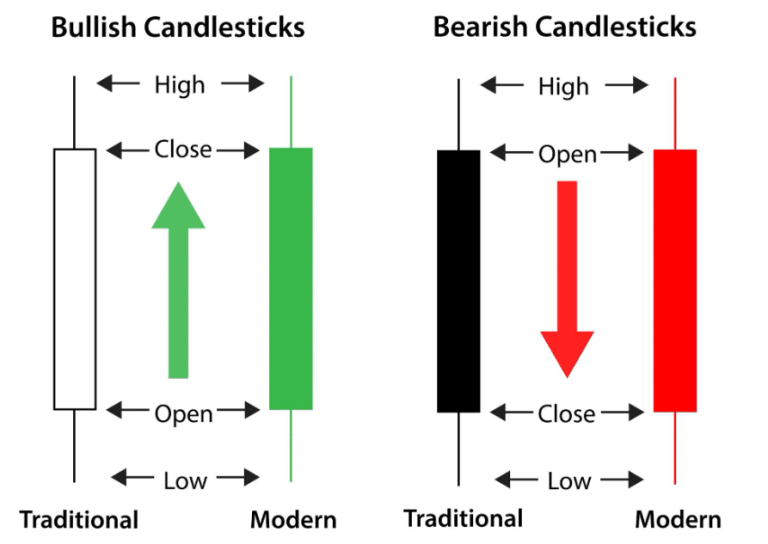
The Bullish Candlestick indicates or shows how the price movement of assets increases over time in the market. The identification of a bullish candle indicates the increase of a price of an asset in the near future. These candles can be identified in green color and the closing price of an asset for a given time period is higher than the opening price of an asset for a given time period. With its anatomy, the bullish candlestick shows Close and High prices at the top of the candle while open and Low prices at the bottom of a bullish candle.
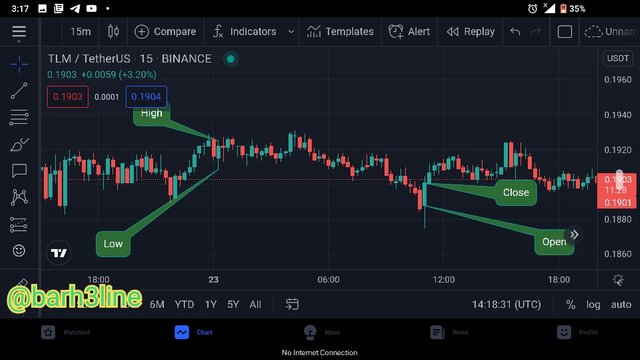
Furthermore, the price beginning point of a bullish candlestick is usually lower than the price closing point, which is a very early indication of likely upward.
BEARISH CANDLESTICKS
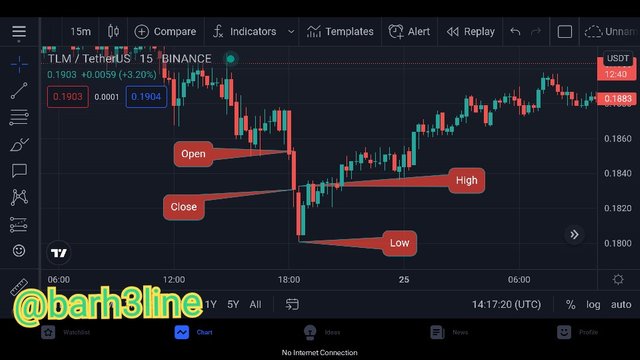
The Bearish Candlestick shows how the price movement of assets decreases over time in the market. The bearish candle can be identified in red color. The closing price of an asset is lower than the open price of an asset for a given period of time. It indicates a reduction of an asset price in the future while also urging traders to buy assets and invest for the future. This Candlestick always indicates both open and high price at the top of the candlestick and close and low price below the Candlestick.
Thank you for reading this, and thank you to Professor @reminiscence01 for this idea lecture.
#club5050 😀