Steemit Crypto Academy Season 5 Beginner's Course - Task 10: Candlestick Patterns.

INTRODUCTION
QUESTIONS
No÷1] Explain the Japanese candlestick chart? (Original screenshot required).
No÷2] In your own words, explain why the Japanese Candlestick chart is the most used in the financial market.
No;;3] Describe a bullish and a bearish candle. Also, explain its anatomy. (Original screenshot required)
No÷1]Explain the Japanese candlestick chart? (Original screenshot required)
This Japanese candlestick, globally it can also be referred to as candlestick chart, the Japanese candlestick seem to be an ancient gadget developed by the Japanese rice trader named Mr, Munehisa Homma, in the 1700s, his discovery became stimulated by the emotions of the rice traders as at that time, presently used nowadays in the stock market analysis, to determine real price movement and the manner of which the market functions.
This Candlestick was invented through the exchange between sellers and buyers on a particular asset. and its a kind of chart pattern used as a pictorial of the price movement along the financial market.
currently the candlestick chart is a nice beneficial indicator in the crypto trading platform, due to the fact that it indicates substantial price movements at each point and with the help of the candlestick chart a can predict the future price changes,
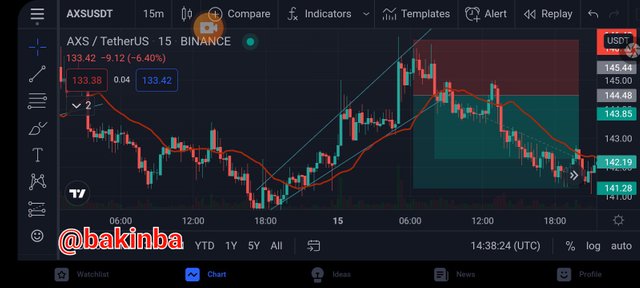
from that image blow👇👇👇👇, you can clearly see how I predicted that the market will go dip and it was possible with the help the candlestick chart.👇👇👇
No÷2] In your own words, explain why the Japanese Candlestick chart is the most used in the financial market.**
From what I understood, the major purpose why this Japanese candlestick chart has became the most used in the financial market, is because it accurately gives a perfect/correct and particular graphical illustration of the price movement at every period of time. And It shows or indicates severa price factors all through the interplay between sellers and buyers
The interesting part or side of the Japanese candlestick chart is that it approve it's work by providing whole information analysis along with it virtual resources in any crypto or chart evaluation, like i said earlier in this post. They truly indicates perceptibly with full amount of supply and summon for that, could be a determinant every time the price changes.
BULLISH CANDLE
A bullish candlestick is the benefit form of a candlestick pattern that forms during the market uptrend, showing a flip-flop. and it accurately shows that buyers has taken control or they are manipulating the market price and as at that moment, sellers has definitely lost it, conclusively, the bullish candlestick indicates that buyers are now in charge in the market.
ANATOMY
The candlestick consists or contain 4 specific part's, the four parts are [Open,] [Close, ] [High,] [Low], the four of them represents a distinct point for the duration of price movement.
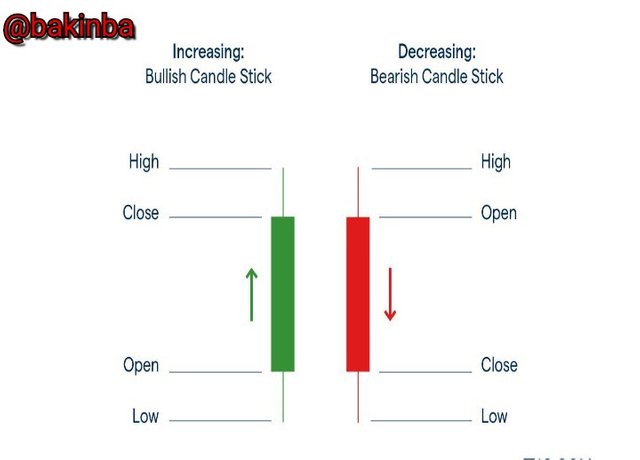
OPEN
The [OPEN] Which means the opening price, the opening usually shows start-up price if any kinds of cryptocurrency.
CLOSE
The [CLOSE] Which we also known as closing price, this closing price is the pattern which clearly indicates the ending part of a candlestick chart, and it clearly show the past
Market records.
HIGH
HIGH Which means the Highest price, it is said to be the part of a candlestick which indicates the greatest price recorded
in a period of time.
LOW
LOW Which means the lowest price, it accurately indicates the smallest or lowest price which has already been recorded in a period of time.
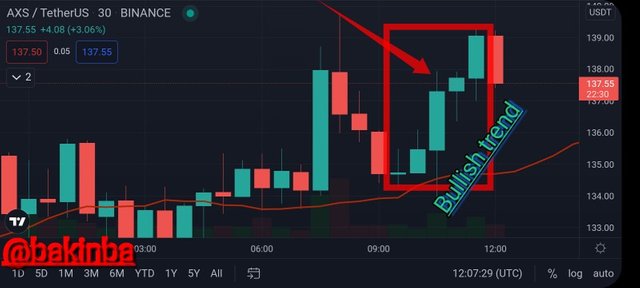
The screenshot below accurately shows a good example of the bullish candlestick chart,
in conformity with the candlestick chart below, you can clearly see that it accurately tells that Axs/Usdt is on a uptrend movement, the screenshot below explains it better 👇👇
BEARISH CANDLE
A bearish candlestick is the swamp type of a candlestick pattern that forms during the market downtrend, showing a reversal alongside the opposite direction. and it accurately shows that sellers has taken control or they are manipulating the market price and as at that moment, buyers has definitely lost it, conclusively, the bearish candlestick indicates that sellers are now in charge in the market.
ANATOMY
in conformity with the last typical anatomy candlestick chart, former candle's
bearish candlestick chart usually opens on top the last candle's,The length of the bearish candle swamps the last green candlestick chart. Bearish candle constantly closes down below the last candles opening
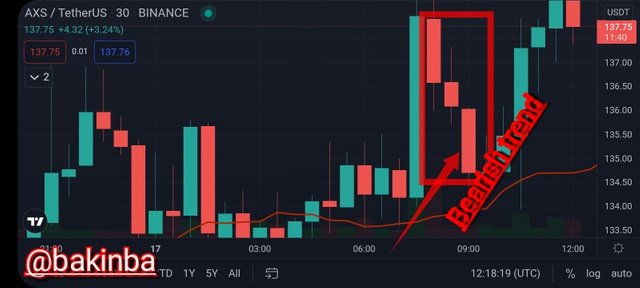
The screenshot below accurately shows a good example of the bearish candlestick chart,
in conformity with the candlestick chart below, you can clearly see that it accurately tells that Axs/Usdt is on downtrend
movement, the screenshot below explains it better 👇👇
CONCLUSION
Honestly speaking, from this lecture I was able to understood how the Japanese candlestick chart works, the candlestick chart was created many years ago, and currently the crypto/forex traders has been using the candlestick chart to perform a good trading strategy, with the
full assistance of the bullish and bearish candlestick chart, there is a possibility in tracking/monitoring the market price movement.
My specific regards to @dilchamo