Steemit Crypto Academy Season 3- Beginners Course for Week 7 | Analysis and Trading with the indicators "Stochastic Oscillator +" Parabolic Sar "||Homework post for professor @lenonmc21 by @badmus-official
Introduction
Hello everyone, it's with honor I was able to participate in this week's homework dynamic course for Professor @lenonmc21 for the first time I will be writing in the community, As I have been looking forward to getting the requirement needed to be able to participate in the crypto academy courses.
It is with incredible energy I am presenting my homework post for professor @lenonmc21 who has given an explanation of the course "Analysis and Trading with the indicators "Stochastic Oscillator +" Parabolic Sar " in the Crypto Academy, fledglings class for week 7 Season 3. In this post, I will be deliberately responding to both the theory and the practical questions as listed below...

1.Define in your own words what is the Stochastic Oscillator?
2.Explain and define all components of the stochastic oscillator (% k line,% D line + overbought and oversold limits).
3.Briefly describe at least 2 ways to use the Stochastic Oscillator in a trade.
4.Define in your own words what is Parabolic Sar?
5.Explain in detail what the price must-do for the Parabolic Sar to change from bullish to bearish direction and vice versa.
6.Briefly describe at least 2 ways to use Parabolic Sar in a trade?
1.show a step-by-step on how to add the Stochastic Oscillator to the chart (Indicating the% k Line and the% D Line, the overbought and oversold zone.
2.Show step by step how to add Parabolic Sar to the chart and how it looks in an uptrend and in a downtrend.
3.Add the two indicators (Stochastic Oscillator + Parabolic Sar) and simulate a trade in the same trading view, on how a trade would be taken.
Define in your own words what is the Stochastic Oscillator?
A stochastic oscillator is an indicator used by traders for looking at a specific shutting cost of a security to the scope of its costs throughout a specific timeframe. The affectability of the oscillator to advertise developments, is reducible by changing that time span or by taking a moving normal of the outcome. It is utilized to create overbought and oversold exchanging signals, using a 0–100 limited scope of qualities. This indicator was developed by a trader analyst called George Lane which he invented some while ago (Late in the 1950s).
Explain and define all components of the stochastic oscillator (% k line,% D line + overbought and oversold limits).
The stochastic oscillator has two components :
% K Line: The %K line makes a comparison between the most minimal low and the maximum high of an offered period to characterize a value range, then, at that point shows the last shutting cost as a level of this range. The %K line is sometimes referred to now and then as the quick stochastic indicator.
and it's been calculated in the format:
%K=(C−L14 ) / ( H14−L14) × 100
where:
C = The most recent closing price
L14 = The lowest price traded of the 14 previous
trading sessions
H14 = The highest price traded during the same
14-day period
%K = The current value of the stochastic indicator
% D line: The % D line is also referred to as a "slow" stochastic marker. it s as well essential as the % Line when getting signals, the line works together with the %K LIne as it's been calculated in the format :
%D Line = 3-period moving average of %K.
Overbought Limits: is the fluctuations in indicators between the range 0-100. When the stochastic %K line crosses the 80 lines, the security is considered to be overbought.
Oversold limits: is also the fluctuation indicator limit between the range 0-100, when the indicator line crosses 20 the security is been considered to be oversold.
Briefly describe at least 2 ways to use the Stochastic Oscillator in a trade.
Trading signals: The Stochastic indicator indicates the trend change, particularly if there's divergence taking place between the oscillator and the price as well. the indicator is efficient when the instrument range in trading….the indicator is useful when spotting whether an instrument is overbought or oversold, now the key signals come from the crossover of these two lines where we are either in overbought or oversold territory. the black line is the faster percentage Kline, the dotted red line is the slower percentage D line we had the percentage K cross below the percentage D line while we were above 80 and that would be an indication of a potential trend change to come .and on top of it we also had divergence because we can see that the indicator is posting lower high prices are posting higher highs and with all of that combined, that is an early warning sign of a trend change and can be seen after that the price began to fall...
Stochastic bull/bear technique
Finally, another mainstream utilization of stochastic indicators is distinguishing bull and bear exchange arrangements. A bull exchange arrangement happens when the stochastic marker makes a higher high, however, the instrument's value makes a lower high. This shows that force is expanding and the instrument's cost could move higher. Merchants frequently hope to purchase after a concise value pullback in which the stochastic indicator has dipped on the pullback and afterward moved higher once more. A bear exchange arrangement happens when the stochastic pointer makes a lower low, yet the instrument's value makes a higher low. This signals that selling pressure is expanding and the instrument's cost could move lower. Traders frequently hope to put a sell exchange after a short bounce back in the cost.
Note: Traders ought to know that the stochastic pointer has restrictions. It's anything but a secure specialized investigation instrument. indicator can regularly produce bogus signs. During rough economic situations, this can happen habitually...
Define in your own words what is Parabolic Sar?
The parabolic SAR is a specific indicator used to choose the worth orientation of an asset, similarly as cause to see when the worth heading is advancing. Now and again known as the "stop and reversal system," the parabolic SAR was made by J. Welles Wilder Jr.This indicator is striking in that, it is tended to as a movement of bits on a chart. This bit is for each situation close to the candle, bar, or any blueprint configuration being used by a trader.The example is considered as a bullish sign if the spots are seen under the current expense,else it is seen as a bad sign. In relationship with the moving typical indicator, it is near, essentially that it moves incredibly speedy than moving ordinary. Using simply this indicator isn't adviceable, it is boundlessly improved if get together with another indicator.
Explain in detail what the price must-do for the Parabolic Sar to change from bullish to the bearish direction and vice versa.
At the point when graphically plotted on a chart, the Parabolic SAR indicator is shown as a progression of specks. In the event that it shows up beneath the current value, the parabolic SAR is deciphered as a bullish signal. At the point when it is situated over the current value, it is considered to be a bearish signal. The signals are utilized to set stop misfortunes and benefit targets.
When there is a change and the signal dots move from beneath the current cost to over, this will flag an adjustment of the pattern. It has now flipped from bullish to bearish, and likewise goes the same as opposite for the bearish i.e the signal dots have to flip from the top to beneath value to change from bearish to bullish.
Briefly describe at least 2 ways to use Parabolic Sar in a trade?
Trend Monitoring: When a trend grabs hold, it might regularly surpass general assumptions for how long it will continue, passing on just the lucky traders who might benefit from the trade.
Having the option to appropriately examine moving conditions of the market is in this way a very helpful capacity, which is actually why the Parabolic Sar is been valuable.
The indicator plots a bent example on a value outline, which portrays likely pause and converse levels, The bend of the indicator is planned to give a manual for the way of a moving business sector. a moving business sector will have a high likelihood of staying inside the limitations of the bend on the outline. in the event that the value neglects to do this and rather gets through the bend, the pattern might have run out of steam. It is at such a focuses in time that you should pause and converse your position.
Trade exiting: You can likewise utilize Parabolic SAR to assist you with deciding if you should close your exchange or not, the three spots shaped at the lower part of the cost, proposing that the downtrend was throughout and that the time had come to leave those shorts.
show a step-by-step on how to add the Stochastic Oscillator to the chart (Indicating the% k Line and the% D Line, the overbought and oversold zone.
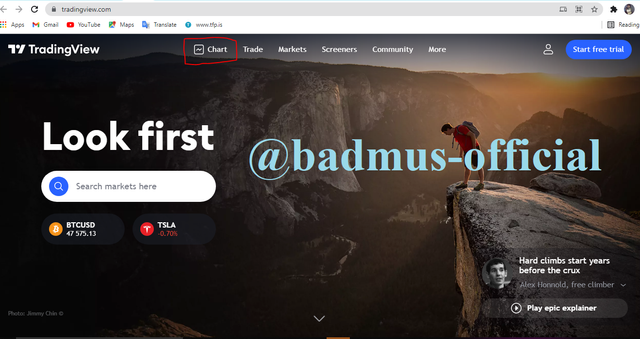
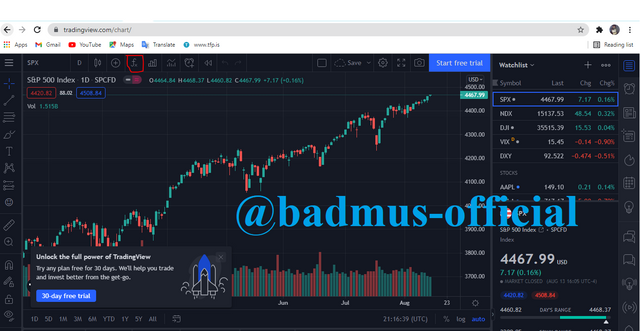
step1: you type in the webpage URL address to a browser https://www.tradingview.com and it get you to image display as below.
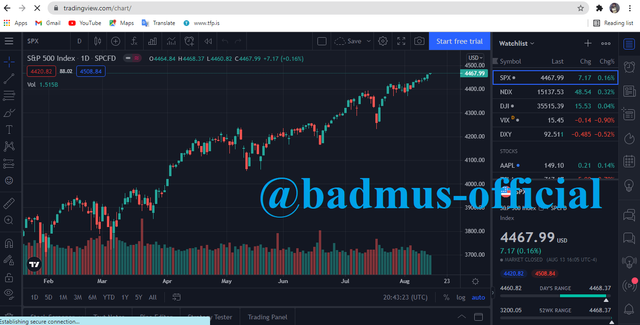
step2: You click on the chart bar just as circled in the image above and it gets you to the live trading chart as depicted below
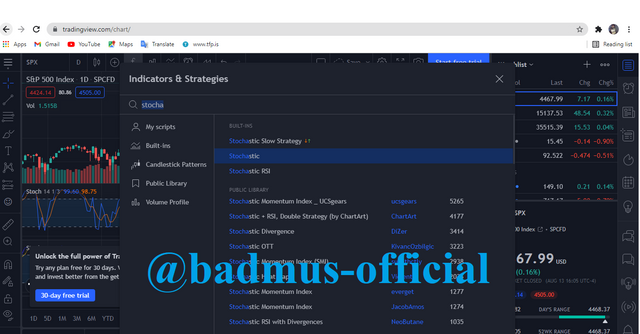
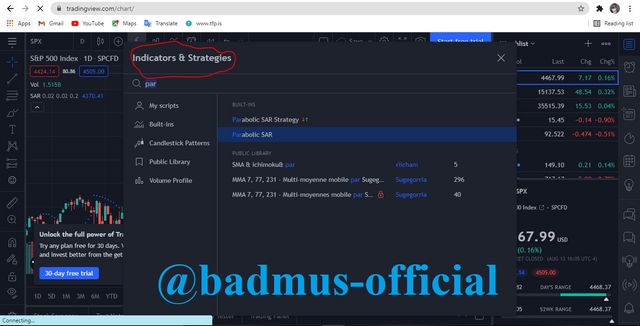
step3: you get to click on the fx bar which pops up indicator and strategy or as seen circled in red at the top of the image below

step4: After clicking the fx bar you get to search for the Stochastic indicator and click on it..image shown below
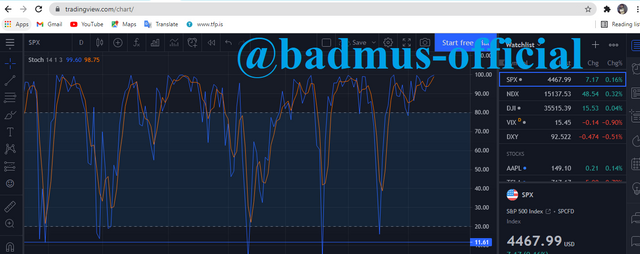
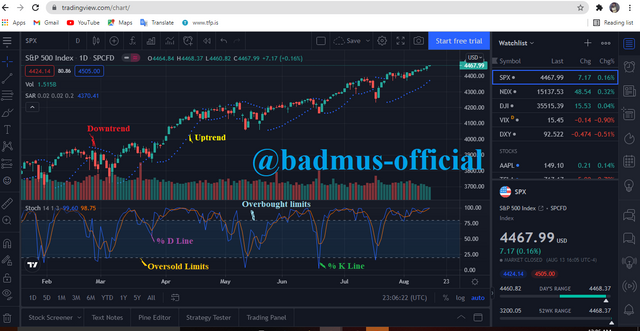
the stochastic indicator is displayed in the chart as shown below where the blue waves indicates the %K line and as well as the brown wave been refered to as the %D line.
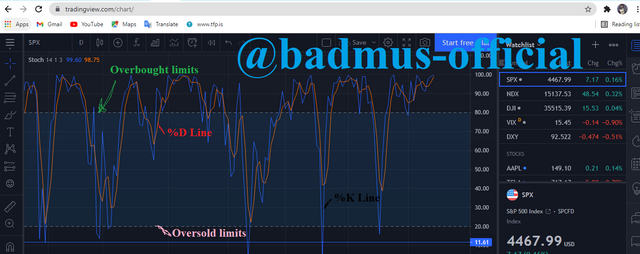
Further explainations were made in the picture below as seen the various lines been labeled out as well as the overbought and the oversold limits been well expressed in the image below..
Show step by step how to add Parabolic Sar to the chart and how it looks in an uptrend and in a downtrend
step1: follow the first three steps use in the question1 above
step2: when you get to the indicator bar (fx) you type in parabolic-sar in the search box provided,image shown below.
the indicator is shown as depicted in the image below showing the upward trend and the downward trend on the chart..
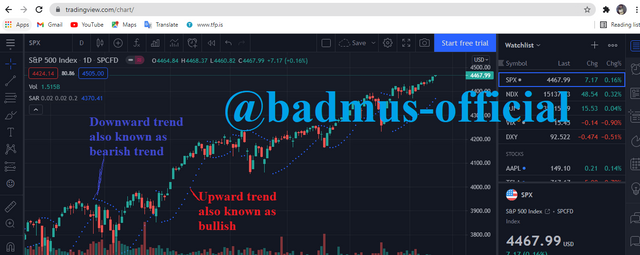
Add the two indicators (Stochastic Oscillator + Parabolic Sar) and simulate a trade in the same trading view, on how a trade would be taken.
the depicted trade was taken in such a way that when the upward trend move to the bottom and the downward trend moves to the top ,it get to create a strong signal which interest trader to buy at the particular period of time..simulation of the trade pictured below..
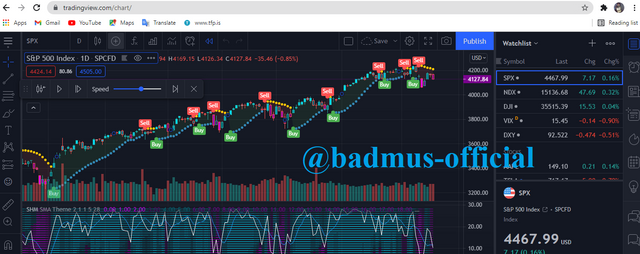
live illustrationn indicating when trader are to buy and sell there market
My attention was been brought to the idea that it is of best interest when making use of this two fabulous indicators as a whole,as i've been exposd to the knowledge, i had like to say to other traders to try and partake out their trade using this two indicator(stochastic and parabola-sar).its with great honor am concluding this homework task,has it has been an intriguing one so far,no doubt have gained a lot even as a first timer on this platform.best of regards to professor @lenonmc21 for the amazing explanation which put this homework in the right spot..i hope i get to write more with you in the nearest on...Thank you!!!!