Price Action + Break-Even Technique - Crypto Academy / S4W4 - Homework post for @ lenonmc21
![Steemit Crypto Academy [Beginners' Level] (6).png](https://steemitimages.com/640x0/https://cdn.steemitimages.com/DQmcw9cVQaKWYQj5vLa8yYJmv9MnVzwsRXmvFxeijYEKLrH/Steemit%20Crypto%20Academy%20[Beginners'%20Level]%20(6).png)
Introductory
Hello everyone, I welcome you all once again to these amazing platform, which on today's post am obliged to be sharing with you one of the trading techniques, tutored by professor @lenonmc21. I will be using this medium to discuss with you about Price Action + Break-Even Technique of Trading. I hope you learn one or two as we go into details;
Question 1 - Define in your own words what Price Action is?
Price action can be regarded as a trading system that assists, with anticipating market developments by spotting signals in the value developments of a market.
Price action in trading helps in investigating the presentation of security, or money to foresee what it may do later on. In the event that your price activity investigation educates you that the cost is rising, you should take a long position, or then again in the event that you accept that the cost will fall, you may decide to short the resource.
Price action signals – are effectively unmistakable signals in a market, which can be utilized to anticipate future market behavior.
Price Action Example:
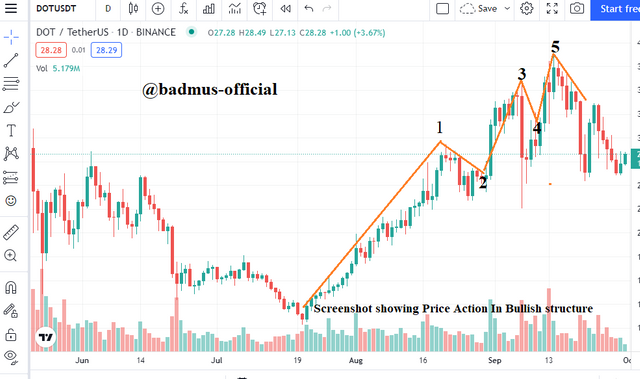
Question 2 - Define and explain in detail what the "Balance Point" is with at least one example of it (Use only your own graphics?
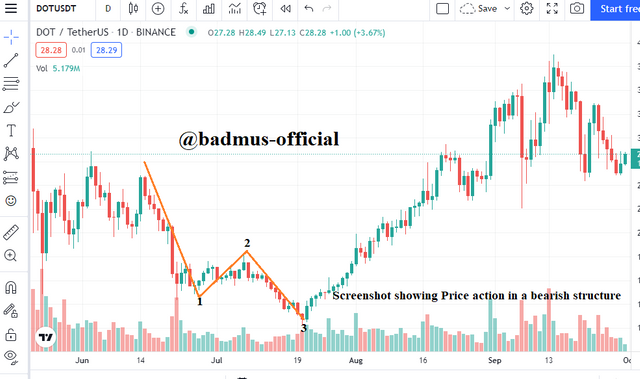
Balance Point is also known as break-even point is the point, where a trend discontinues from its initial trend such as a bullish or bearish trend, and then took another phase of the trend. The Balance point is the point marked last at the end of the last trend candle before the trend picks another pattern.
Image Analysis Below:
Question 3 - Clearly describe the step by step to run a Price Action analysis with "Break-even"?
Price Action are best secure when you trading it with a balance point, in a sense that, you pick a trading strategy with your balance point and run it through with the market price Action so as to know which way is more secure for your trading. I Wil be explaining procedures on how to run price Action analysis with break even as follows;
Firstly, Set up a time frame that is best convinent for your trading, in a sense that, you can choose any time interval on a chart that is convinient for you to study the price activity of the market for sometime first, depending on you, 1 hour or more or less, time varies depending on the trading platform you are using.
Secondly, after setting your convinient time frame, whats most important next, is to mark your break even point i.e the last candle stick before a high uptrend or low trend , and choose the best balance point you find to be more convinient to work with and execute your trading on that.
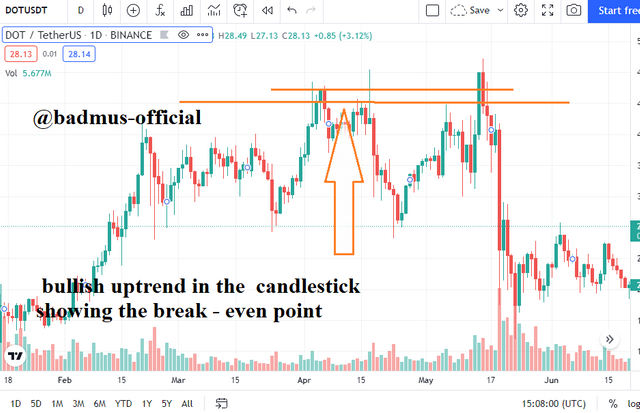
Thirdly, after setting up with the two parameter mentioned above , what's best is to choose a best position in the equilibrium trend I. E the horizontal lines marked which you did set for the balance point and make a trading decision on that and set up a entry level or exit that's most likely promising for a successful trading.
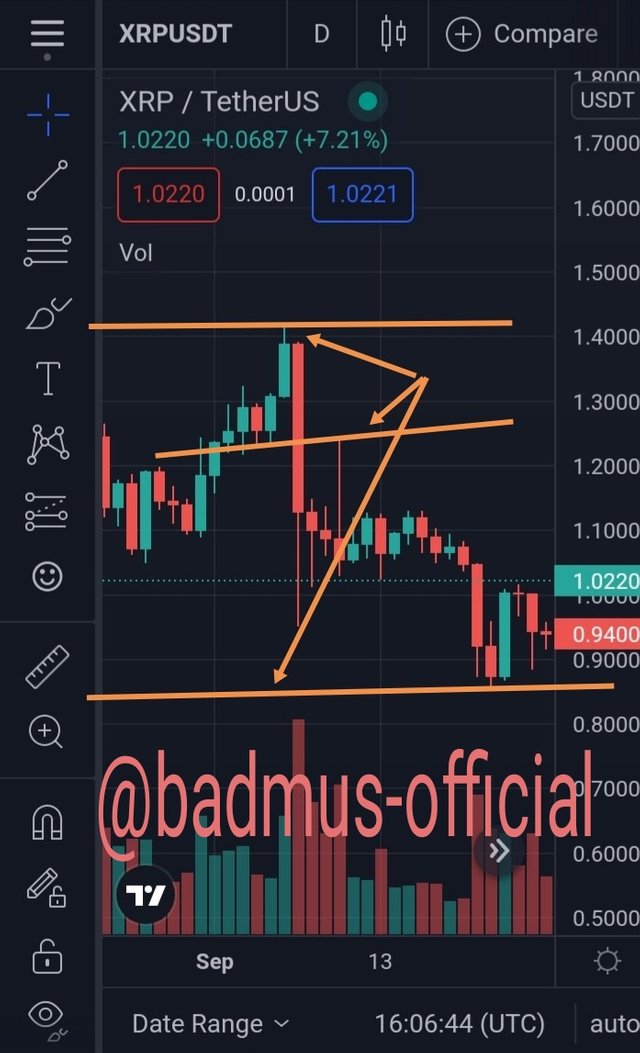
Image showing the resistance level on the chart when the trend started a high trend of bullish.
Question 4 - What are the entry and exit criteria using the breakeven price action technique?
Using break even action method of trading make it little bit easier to identify when to enter or exit our trade.
First thing first, is to be sure of the technique you are using to carry out the trade then set the target to exit a trade at the resistance level, that is when there is a high trend of bearish in the equilibrium set by the trader, using the break even point mentioned earlier that is when the market is showing resistance in the chart.
Secondly is to identify the entry of the trade, and this is easily done as well, when the equilibrium set using the procedures mentioned is showing lot of support level, that is the price Action with the balance point are forming a good trend of bullish and this are tallying with the market level, then at that point is best to make an entry to the trade.
Question 5 - What type of analysis is more effective price action or the use of technical indicators?
First thing first , we should have in our mind is that , there is no better way of carrying out a trade, we can only minimize the risk by carrying out several techniques of trading.
In my own opinion on regarding which one is better, I'd choose price Action method of trading to technical indicators, because with price Action you were able to Acces live pattern of the market without any confusion or bogus signals as you are the one total in charge of the tool you are using . carrying out a trade with (price Action + balance point) technique seems less easier and less complicated comparing to indicators as you are not to be bothered whether the indicator is tallying or not, as you are the one in charge of the tool you are using for your trading. No need of carrying out verifications externally to be sure your trading tool is tallying with market action. So in my personal opinion I prefer price Action trading method.
Practical
Make 1 entry in any pair of cryptocurrencies using the Price Action Technique with the "Break-even Point" (Use a Demo account, to be able to make your entry in real time at any timeframe of your choice)
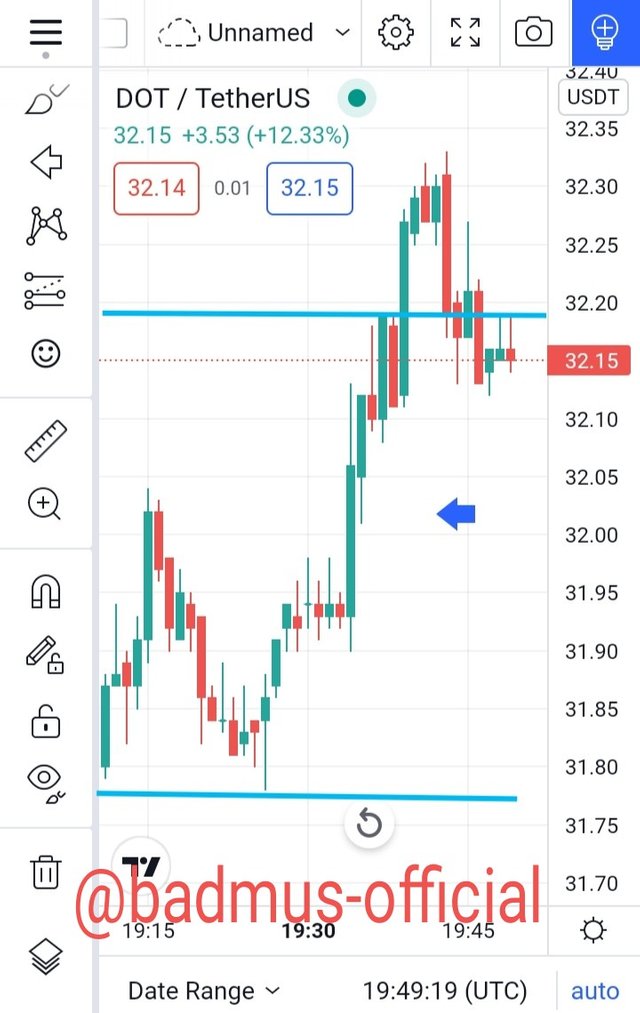
For this task, I will be making use of DOT/USDT pair as seen below. Then I did set my time frame on the chart to interval of 15 minutes so as to get my price Action live as visual as possible, then I did set a balance point which happens low beneath where I drew the horizontal line for the break even point and then I adjusted my horizonatal line as well at the top end of the uptrend to set an equilibrium so as to know the direction at which the market is moving. After carrying on all this, we did saw a huge uptrend level where I arrow marked when the market is forming a bullish trend, then that's the point where you are to make your entry at the perfect time the market is agreeing to bullish and possible future development.
Note: There were change in my pattern graphical display of trading chart due to change of materials. Unless, otherwise stated all materials are owned by me.
Conclusion
Price Action signals are effectively unmistakable signals in a market as they appear right to you on the trend , which can be utilized to anticipate future market behavior and to carry out market decision on by using break even point with. This pattern of trading show promising and effectiveness as they are less complicated and are drift from bogus signal I. E, they can not be intervene by a third party as they are just personal trading decision method and offer more promising feautures which I would definitely be working on in later few days.
Thank you all, for following through on my post, see you on my next task!!
Special thanks to professor @lenonmc21, for the great lecture.