Effective Trading Strategy using Line Charts -Steemit Crypto Academy | S6W1 | Homework Post for @dilchamo
Hello everyone, I welcome you all from the longest break of the crypto academy, it must have been a little while since you all participate in the crypto courses in this community. Here we go again in another season, a new week in the crypto academy, its a privilege that the academy will be diverting to trading-related courses this season as most of us will be able to understand more regarding crypto trading.
On today's task, I will be giving insights on the course tutored by professor @dilchamo regarding "Effective Trading Strategy using Line Charts", i.e, how we can trade cryptocurrencies using Line Chart which is different from the candlesticks we are familiar with at defaults. From here on, I will be answering the questions in detail.

A line chart which can also be referred to as a line graph is a sort of diagram that gives a visual description of the information in an orderly manner using lines. A-line chart is conceivably the easiest trading strategy to use to see any monetary information and markets trading information at a particular period.
A-line chart is a type of graphical portrayal of information that is joined constantly with the assistance of a line. This line can either be straight or bent depending upon the market being explored at that period. A-Line chart is the least complex type of addressing quantitative information especially assets like cryptocurrency between two factors such as crypto pairs as they are displayed with the assistance of a line that can either be straight or bent. Traders utilize the line chart to portray the highs and lows on the lookout for a specific worth of an asset since it gives an unmistakable representation of that information at the time.
A line chart also comprises a flat line which is on the x-axis, and an upward line on the y-axis to address the information. The x-axis shows the time, date, and year span while the y-axis shows the price of the assets that are being estimated. In Summary, the line chart plainly shows the expanding or degrading pattern of specific assets.
Now, let me give an illustration of how we get to include a Line graph on a crypto chart. For this illustration, I will be using Tradingview.
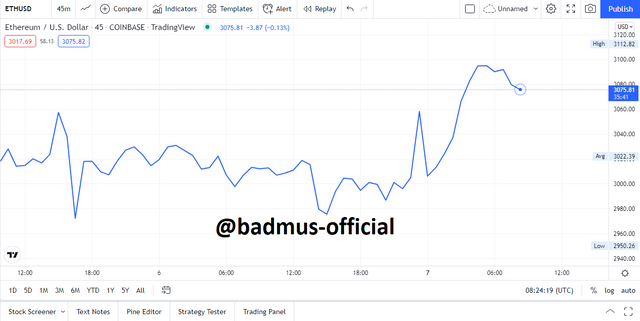
Firstly, Launch the trading platform Tradingview to select the crypto pairs of your choice just as seen I am using ETHUSDT crypto pairs below, then by default, your chart displays using Candles, then we click the candle to select Line.
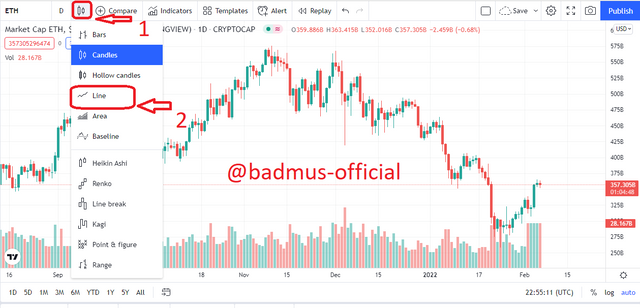
now after choosing Line, we could see the assets graphically been displayed using a single Line, Trading with this Line is what is been referred to as Trading Strategy Using Line Charts. Image Description below;
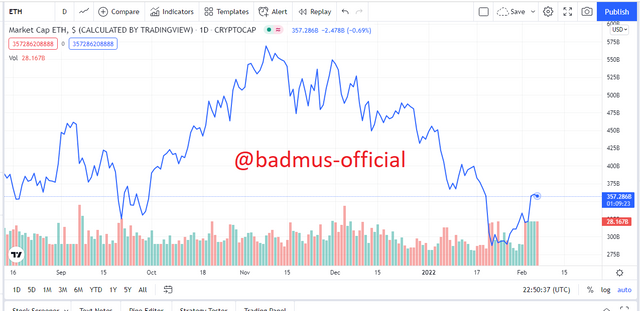
The Usage of a Line chart can never be overestimated, below, I will be listing the important usage of Line Charts When Trading any Crypto Assets.
A-line Chart can be used to see changes in a market after some time.
A-line Chart can as well be used to distinguish patterns either bullish or bearish and as well, it can be used to site spikes and plunges in crypto assets.
A-line chart can as well be utilized to follow the progressions of the market over a short and extensive period.
A-line chart is better 100% of the time to utilize, as at whatever point the little changes that occur in the market exist on the line chart whereby it reduces noise.
It can as well be used to anticipate Trends at a period.
The Support and resistance levels are two important levels involved in trading as they assist traders with acquiring additional understanding into the strength of a value of an asset.
Support and resistance levels are the horizontal value levels that ordinarily interface values using the lines as they swing highs to other value highs or lows to lows, framing even levels on a chart. The market's scope of development levels exist as a result of market interest -, for example, assuming there are a larger number of purchasers than venders, the cost could rise, and on the off chance that there are a greater number of sellers than purchasers, the value will in general fall.
Now let's see how we can identify each level using a line chart;
Support Level: - The Support level is the level at which the price of an asset stops falling, i.e this part we could consider buyers picking interest in particular assets keeping the assets price to bounce back up, these lines are been depicted evenly on the chart i.e it is the point the cost routinely quits falling and bounces back up.
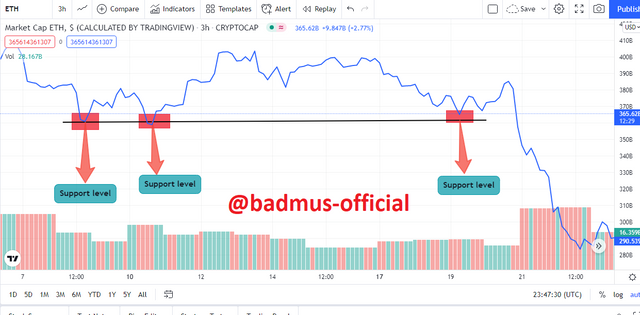
From the image above, we could see the support levels as it occurred at the point the price tends to come up from a downtrend.
Resistance Level: - The Resistance level is quite the opposite of the support level as it is the level at which the price of an asset stops rising, i.e this part we could consider sellers selling the particular assets keeping the assets price to fall, these lines are been depicted evenly on the chart i.e it is the point the cost routinely quits rising and starts falling.
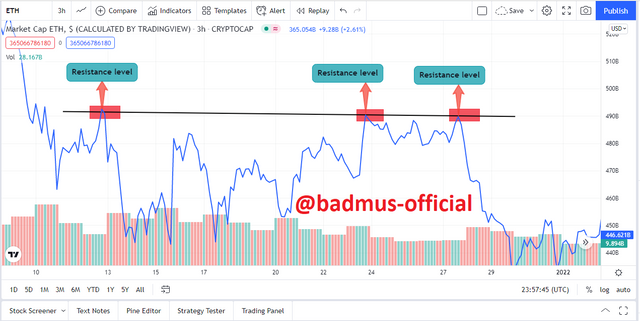
From the image above, we could see the resistance levels as it occurred to be at the point the price tends to break down to a downtrend.
The types of charts vary depending on the trader's experience as all these charts have their main purpose regarding trading we have several types of charts which are Candles, bars, lines, etc. but here on, I will be discussing and differentiating the difference between line charts and candlestick chart.
Line Chart: From my previous explanation, I did explain that line charts displays the values of stock using a single line only, which seems to be the easiest as these sort of filters out noise, and as well beginners traders can easily see the pattern of assets at that particular time, importantly, we could say that Line Chart depicts the close price of assets at the particular time. causing the chart to have less information as these can be used to easily read the market direction at a particular time.
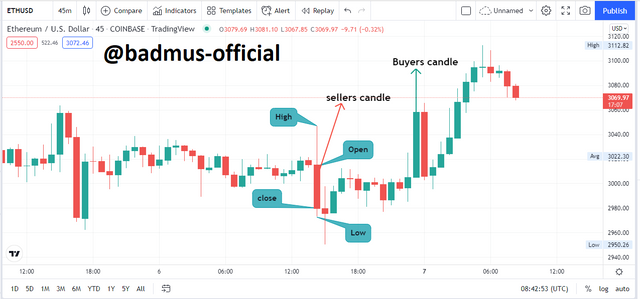
Candlestick charts: - The CandleStick charts which we are most familiar with give the variation of an asset, these consist of two candles which are Green and Red, where the green depicts the buyers and as well the red candles represent the sellers. with candlestick we get to see the highs and lows of the assets as well as the Open and close price, we also get to notice the volatility In the assets price. we can see these depicts lots of information when compared to the Line Charts, with the Candles chart, we can easily set a stop loss level and a take profit level when making a trade, which seems to be the benefits the Candles over the Line Charts.Image Description Below
| Candles Chart | Line Chart |
|---|---|
| Display Multiple Information(Highs, Open, Close, and Lows) | Display only single data(Close Price of an asset) |
| Shows Volatility of an asset | No volatility displayed. |
| Mostly used by expert traders | Easy to understand for beginners. |
| Can be used to set stop loss level and take profit targets | Can not be used to set much trading decisions. |
Moving Average Indicator
The Suitable indicator I will be combining with the Line chart is the moving average indicator, the moving average indicator is as well known to depict signal of values using a single line, that is, it depicts the average movement of assets in a particular time, we could as well use this indicator combined with the line chart to have a clear entry before making a trade decision, as we know that before one could make a trade we add other suitable indicators to be sure of our market entry or exit.
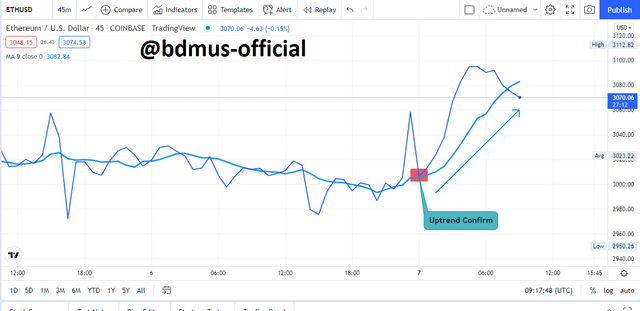
From the image above, we could see a clear uptrend as the line chart(Price Action) and the Moving average both decided to give an uptrend result, at that point, the moving average strengthens the signal of the assets at that particular period.
MACD Indicator:
The other indicator I will be combining with the Line chart is the MACD indicator, just like I said earlier, we combine indicators to a chart to improve our trading decision, whereby the point where we get to witness the indicator and the Price action signaling the same movement strengthens the confirmation of our trade. Now from the image below, we get to see how I combined the MACD with the line chart on a trend.
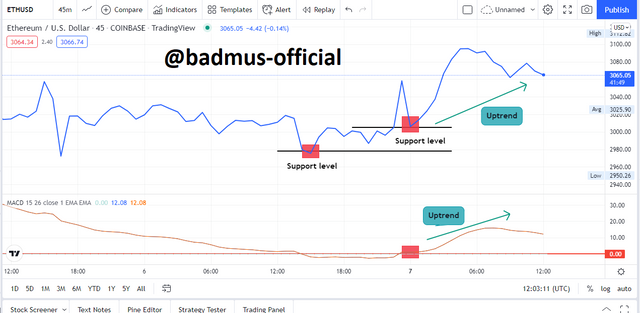
As seen from the image above, we get to confirm the support level as we know the support is the point when the market quits falling and bounces back up, which at that point, a bullish signal is expected, from the analysis, we get to see the support level at the point the line moves ahead of the 0.00 horizontal line of the MACD indicator which means the market bullish is expected to occur which is as seen from the chart above.
Now I will be explaining trading opportunities using the Line chart and as well the Head and Shoulder pattern strategy to identify a Bullish and Bearish Trade.
Bearish Trade: - A Bearish Trade occurs when the market is showing a downtrend which is at that point traders decide to sell and make a profit regarding the decision. to Strengthen my sell entry I combined the Line chart in addition with a popular trading strategy known as head and shoulders pattern strategy whereby when the price action gives this pattern, a bearish market is expected to occur, as well as what occurs in the chart description below.
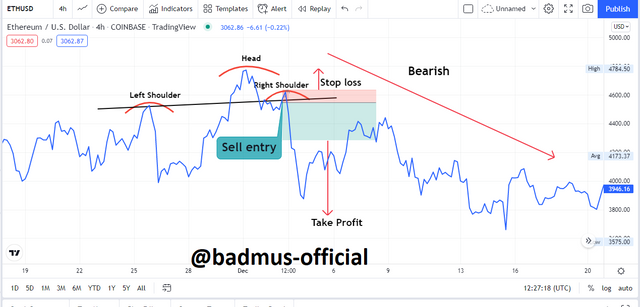
From the image above, we could see how I set my sell entry below the Right Shoulder as this is the point the market is expected to break low as predicted, and as well I did set my stop loss level above the Right shoulder closer to the Head and as well the Take Profit level was set in the ratio of 2:1 to the target, which at this point traders decide to take profit.
Bullish Trade - A Bullish Trade occurs whenever the market is showing an uptrend which is at that point traders decide to place a buy order, to make a profit. To Strengthen my Buy decision, I combined the line chart in addition with a popular trading strategy known as the Inverse head and shoulders strategy whereby when the price action gives this pattern, a bullish market is expected to occur, as well as what occurs in the chart description below.
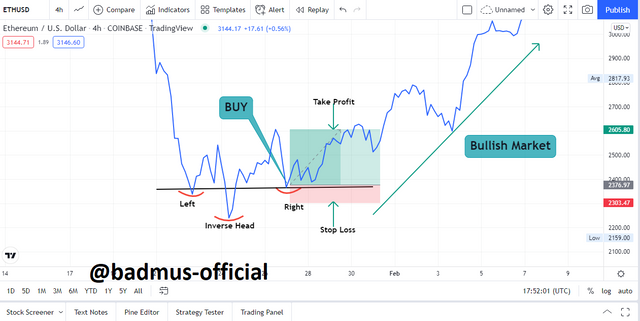
As we can see From the image above is the market of ETHUSDT in a timeframe of 4hrs, we could see how I set my entry above the Right Shoulder as this is the point the market is expected to break high as predicted, and as well I did set my stop loss level below the Right shoulder closer to the Head and as well the Take Profit level was set in the ratio of 3:1 to the target, which at this point traders decide to take profit.
I will be giving a brief illustration regarding the Line Charts below, as we know the Line Chart displays information using a close price which makes it easier to read the price action at a particular time. Thou we should know that we can't make serious trading decisions with the Line char,t I can as well say it is only used for simple trading as we know that the crypto market is delicate, so one has to be extra careful when making a trade.
Advantages Of Line Chart
Display Assets Price in a Single line with less information.
It makes the market easier to read mostly for beginners.
It Can Easily be used to identify markets trend, support levels, and resistance levels as well.
It Can easily be combined with some trading strategy such as the Inverse Head and Shoulder Pattern Strategy as the Line Chart tends to give a clear signal as it filters out the market noise.
Disadvantages of Line Chart
The Line Chart can not be used when making a real trading decision as some trades requires the open, high, lows, and close of the candlestick.
Sometimes the Lines can be messy causing the trading decisions not to be clear.
The Line Chart doesn't depict usable information like the volatility of a market which we get to see in other charts like candlesticks.
From the Homework task above, we have learned some useful information needed to get a trader to start effective trading using the Line Chart, as said earlier, the Line Chart tends to display the market direction using a single line, which with that, traders can easily see the market position whether it is in bullish or bearish, as well, with the line chart we get to see the market supports and resistance level easily.
We have also learned that the Line Chart is best combined with other indicators such as the Moving Average indicator to strengthen our market entry or exit, as the point we get to see the Line Chart and Moving Average move same direction tends to confirm the position as this means we are good to go with the trade.
The Line Chart is mostly used in a simple trade for example a future trading decision can be taken with a line chart but serious trades which require a clear understanding of the previous market price could be established with the Japanese candlestick instead as the candlesticks tends to provide more information to traders.
Here comes my submission to the assignment as I have gotten to understand some basic strategies one needed to know before executing a trade with the Line chart. Special mention to professor @dilchamo, it is well indeed a great course to partake in.
Steemit Cryptography Student: