Crypto Academy Season 4 Week 2- Homework Post for @reminiscence01[Technical Indicators] by @badmus-official
![Steemit Crypto Academy [Beginners' Level] (1).png](https://steemitimages.com/640x0/https://cdn.steemitimages.com/DQmby8rp576XYUS6tKqcFbpxzmDtMCWjFFEfjiYaU7Da6hv/Steemit%20Crypto%20Academy%20[Beginners'%20Level]%20(1).png)

Hello everyone, I welcome you all to the second week class of the new season(Season 4) of the crypto Academy, it's privilege to be learning on this platform which has been great so far, without wasting much of our time today, I will be giving details on technical Indicators, how to add Indictators to a chart and as well differences between categories of indicators. I hope you fasten up and enjoy the details
Question 1a.) - In your own words, explain Technical indicators and why it is a good technical analysis tool?
Technical Indicators can be referred to as a bunch of logical instruments that specialized trading experts use to recognize currency estimating patterns on the charts and to acquire bits of knowledge in and the capacity to foresee the future value developments of the particular currency.
Indicators have been intended to check cost and volume information and produce a graphical portrayal of significant experiences identified with the current data.
Examples of technical indicators are
Relative Strength Indicator (RSI)
Parabolic Sar (SAR)
Stochastic Fast (StochF)
Aroon Oscillator (ARO) and others
Why Technical Indicator is a good technical analysis tool
Thou as discussed earlier, we have lots more types of technical indicators with varied features but on this, I will be discussing what usefulness they all have in common
¶ Price Alerting: An indicator can be set as an alarm when the price of an asset is declining. At such a time it very well might be a sign to fall out of a trade. Then again in case, there is a huge positive rising, it might as well fill in as an alarm to look for obstruction-free trading.
¶ Prediction: Indicators can additionally be used to anticipate the heading of future costs of trade so as to predict when it falls next or when next the particular asset might rise.
1b.) - Are technical indicators good for cryptocurrency analysis? Explain your answer.
Yes, Technical Indicators are good for cryptocurrency analysis
In a sense that with indicators you can trade easily and wouldn't need to monitor trends 24/7, as indicator tools makes it easier to view trends and as well predict what might happen nearest. One of the interesting parts of these indicators is that you get to make use of more than one indicator in a sense that You can use more than one indicator at a time to monitor a chart which this separate indicator offers different features which makes your trade safe and less risky.
1c.) - Illustrate how to add indicators on the chart and also how to configure them. (Screenshot needed).
In this section, I will be showing how to add the stochastic indicator to a chart making use of the website Trading View and also how to configure the indicator.
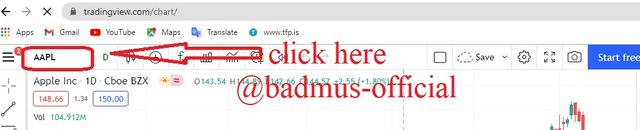
- Step 1
Visit the website Tradingview
Then you click on the circled space to select the currency you'd like to explore in my case I choose Binance coin / USD
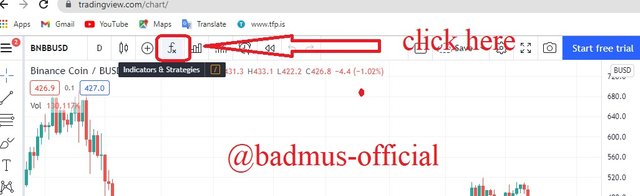
- Step 2
Then you click on the tab fx as shown in the picture display below
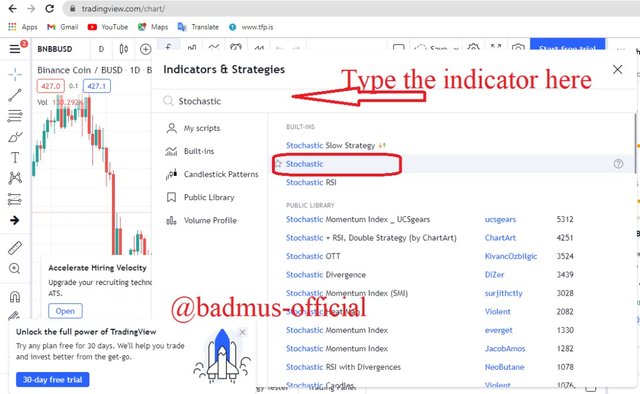
- Step 3
In step 3, You type in the preferred indicator you'd like to make use of and click enter and afterwards close the search tab and go back to the previous page.
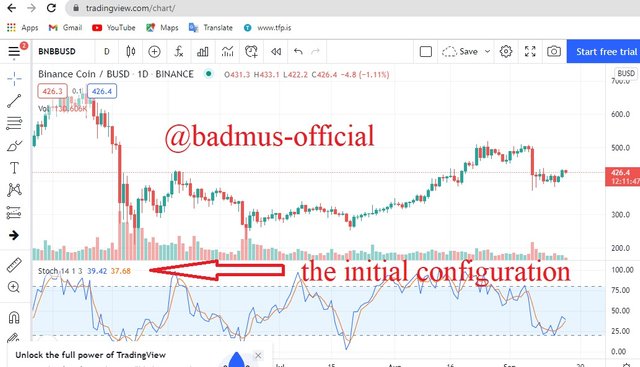
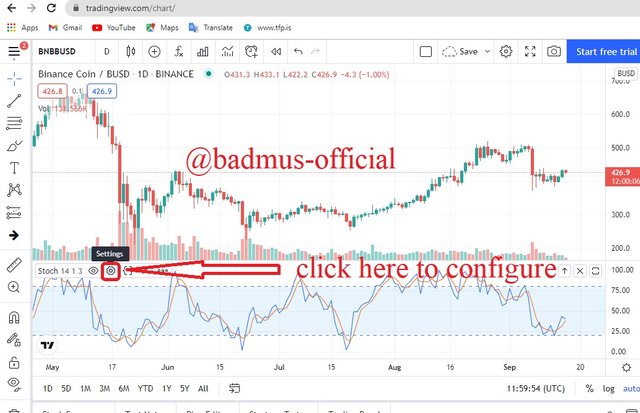
- Step 4
Step 4 shows the stochastic indicator been added to the chart with the initial configuration
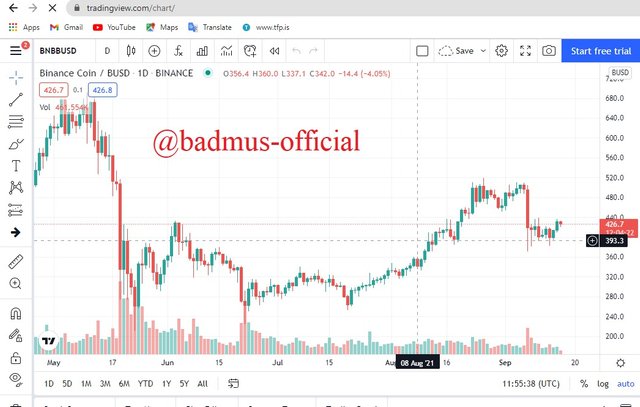
This shows the chart before adding the indicator
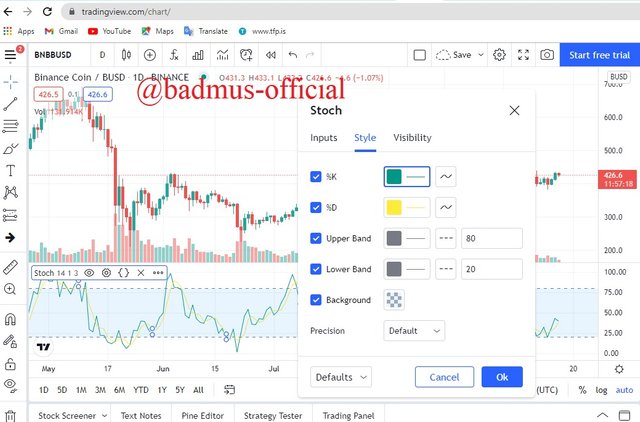
How to configure the indicator
To configure the indicator one simply click on the Settings option
then you can simply choose configuration due to your preference, just as I did now I change the %K line of my indicator to green and change %D line to yellow, and as well a lot of configuration can be done like changing the inputs line thickness, visibility, and others.
Question 2a) - Explain the different categories of Technical indicators and give an example of each category. Also, show the indicators used as an example on your chart. (Screenshot needed).
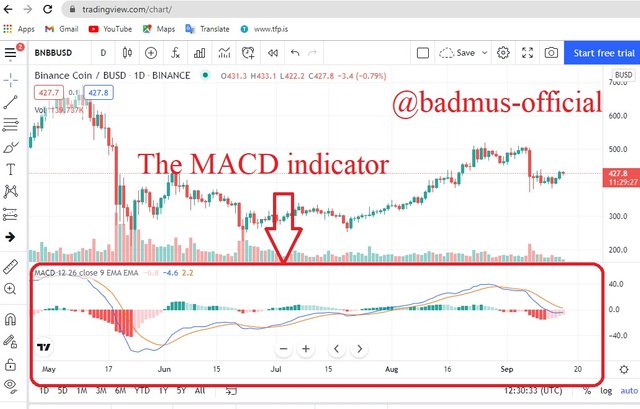
Regarding the topic discussed by the professor, there are different categories of Technical indicators, which I personally will be giving an explanation on three of them
¶ Trend-based Indicator: Trend indicators are indicators such as MACD, Parabolic SAR, and others, and they are all utilized to distinguish a pattern.Trade based indicators assist by revealing to you which course the market is moving in, in case there is a pattern by any means. They're some of the time called oscillators, since they will in general move among high and low pattern like a wave exchange.
¶ Volatility Indicator: are used disclose how much the cost of an crypto asset has been changing in a given period of time. Volatility indicators are vital piece of the market, and without it's basically impossible to bring in cash in a sense that the cost needs to move for you to make a benefit out of the trade.
The higher the volatility is, the quicker a cost is evolving.
Low volatility shows little value moves, high volatility shows enormous value moves.
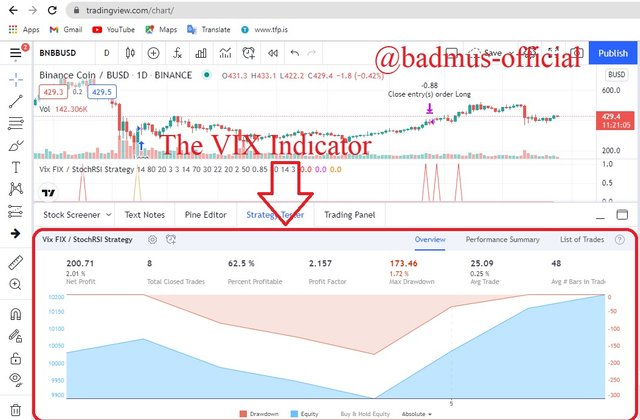
Examples of volatility indicators are Average True Range, VIX, and Bollinger Bands.
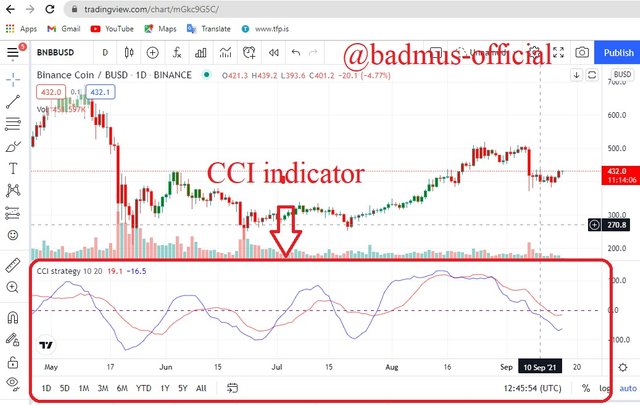
¶ Momentum Indicators: Momentum Indicators are basically wavering indicators and are generally valuable for deciding overbought and oversold positions and can be extremely helpful in flagging the beginning of a recent trend. RSI, Stochastics, and CCI are examples of momentum indicators.
2b) - Briefly explain the reason why indicators are not advisable to be used as a standalone tool for technical analysis.
Technical Indicators sometimes missed out Important Information in a sense that Trading indicators are only intended to help with your interaction on a trend , not be the one making decision for you meaning that Indictators are a derivative of a cost. And They basically show to you what has occurred, not what will occur in a trade, so it's better for individual to carry on his own research, learn more about the asset he is trading and as well check the correspondence with the current chart and not just solely depend on Indicators when making decision especially when deciding to buy or sell .
2c) - Explain how an investor can increase the success rate of a technical indicator signal.
Just like has been said earlier technical indicators sometimes might give bad signal but this can be eradicated in a sense where by an investor can choose to use more than one indicator, more than one indicator, I mean more than one indicator in a sense that by not using indicators belonging to same category for example using stochastic indicator and RSI in a trade is not well enough its rather you pick of different categories then with that kind of action there is no way two or three different categories of indicators can give false trend, so with this been said investor also have to put at mind not to solely depends on Indicator only as they are not to be decision making tools rather help you navigate easily through a trend.
Conclusion
Its been learnt in this topic that technical indicators are tools to help traders navigate easily through a trend and there are different categories of indicators offering different purpose and one must understand fully well not to only depends on Indicators when making trade decision, it's best if one make use of multiples indicators from different categories as to be sure the pattern is corresponding with the market volume.
I hope you've learnt a thing or two on technical indicators on this topic. THANK YOU!! For visiting my blog as I anticipate to see you In my next post.
cc:
@reminiscence01