Steemit Crypto Academy Season 4 Beginner's Course - Task 10: Candlestick Patterns
Greetings CryptoAcadamy,

1a) Explain the Japanese candlestick chart? ( Original screenshot required).
b) In your own words, explain why the Japanese Candlestick chart is the most used in the financial market.
c) Describe a bullish and a bearish candle. Also, explain its anatomy. (Original screenshot required)
1a) Explain the Japanese candlestick chart? ( Original screenshot required)
The Japanese candlestick is a graphical representation of a commodity or asset's price in a financial market.
The candlestick is created by the interaction of buyers and sellers on a specific asset. Traders use the candlestick chart to figure out when to enter or exit a trade. The candlestick is separated into four major sections: the opening price, the closing price, the high and low. The state of the candlestick at any given time is determined by these features.
Munehisa Homma, a rice trader from Japan, developed the Japanese candlestick in the 1700s. Based on his understanding of supply and demand, how prices change, and their impact on the financial market, he was able to successfully create the candlestick chart.
One of the benefits of the Japanese candlestick is that its structure is very simple and easy to visualize. Also, in cryptocurrency trading, the candlestick chart is extremely useful because it shows buyer and seller sentiments as well as who is in charge of the price.
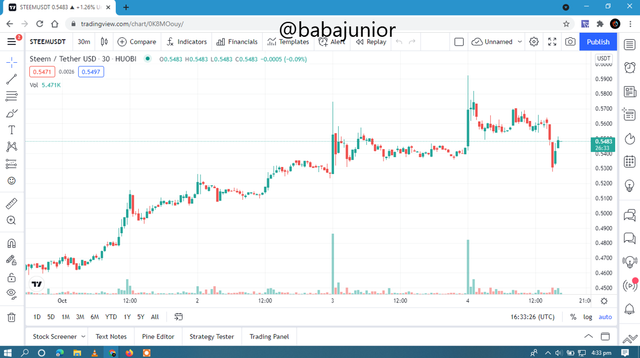
screenshot from https://www.tradingview.com/chart/0K8MOouy/
b) In your own words, explain why the Japanese Candlestick chart is the most used in the financial market.
The Japanese candlesticks are simple to understand and read. Even beginners can read and understand these charts because they are always presented in a very clear manner. They're also simple to comprehend.
Candlesticks can be used in conjunction with other technical indicators to provide the most accurate market predictions. The indicators increase the effectiveness of the candlesticks, and the combination produces very precise results.
Japanese candles offer information about the opening and closing prices, allowing users to see the previous price and hence estimate a future price.
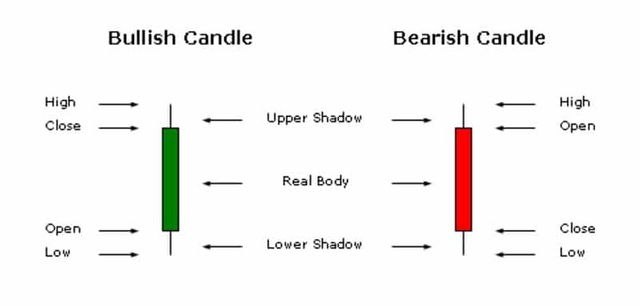
c) Describe a bullish and a bearish candle. Also, explain its anatomy. (Original screenshot required)
Bullish Candlesticks
The price opening level of a bullish candlestick is always lower than the price closing level, which is a quick indication that the uptrend is still going strong.
Bullish candlesticks can be colored in a variety of ways, including green and white, depending on the trading configuration.
Anatomy Of A Bullish Candle.
The bullish has four major components. We have high, low, open, and close
OPEN
It is the part that specifies the beginning of all price movements.
CLOSE
The last price recorded in a candle is indicated by this part of the candle. It indicates when the candle will burn out within a certain amount of time.
LOW
The low part is a section that shows the lowest price listed at any given time.
HIGH
The high part is a section that shows the highest price listed at any given time.
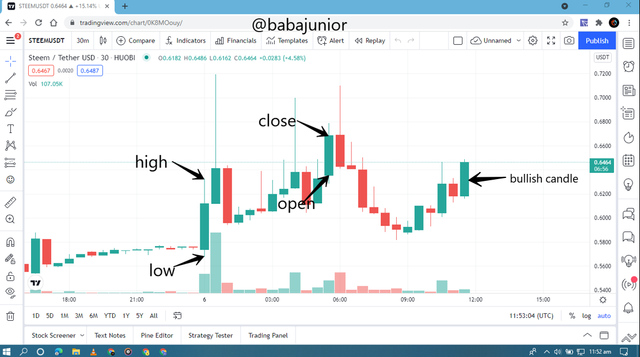
screenshot of STEEM/USDT https://www.tradingview.com/chart/0K8MOouy/
BEARISH CANDLE
This is a candlestick pattern that appears in an uptrend and shows a reversal in the direction of travel. This effectively means that the seller has been able to seize control of all the prices that the buyer has been unable to locate.
Anatomy Of A Bearish Candle
The bullish has four major components. We have high, low, open, and close
OPEN
When it comes to the open section, this is where the price was set at the start of the time interlude. As a result, the open price of the bearish candle is higher than the close price.
CLOSE
When it comes to the closing section, this is where the price was set at the end of the time interlude. As a result, the close price of the bearish candle is lower than the open price.
HIGH
When it comes to the high section, the highest tip the price has been able to achieve during the time interval is usually the highest tip the price has been able to reach. With the high price, we can see how bearish the market has been throughout the time interval.
LOW
When it comes to the low section, the highest tip the price has been able to achieve during the time interval is usually the case. With the low price, we can see how bearish the market has been throughout the time interval.
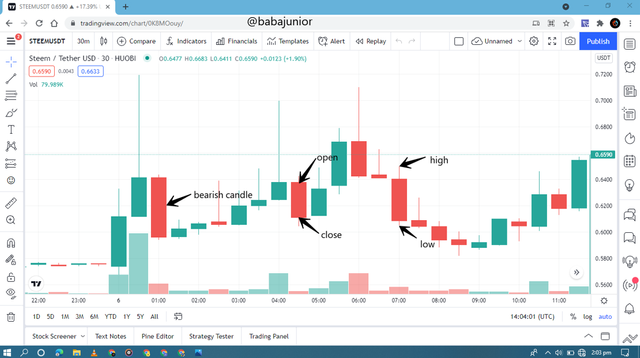
screenshot of STEEM/USDT https://www.tradingview.com/chart/0K8MOouy/