Trading Strategy with Median Indicator - Steemit Crypto Academy |S6W4| - Homework Post for Professor @abdu.navi03


Greetings to all. I am glad to be able to partake in this homework task for season 6 week 4. I shall now proceed with giving answers to the questions asked by Professor @abdu.navi03, based on my level of understanding so far.
Here is the Link to the lesson taught, and i urge you to learn something new.

1. Explain your understanding with the median indicator.
The Median Indicator is a trend base indicator which traders use during trading to sort out the direction in trend and volatility of the said asset in the market. It is a technical tool which effectively locates trends in the market, just like the Moving Average tool, and it (median line) is also similar to an EMA of common lengths.
However, it differs a bit from other trend base indicators in that the volatility in the market is calculated with the aid of a channel made by an ATR on the Median line. This ATR is established above and beneath the median line, as it calculates an determines price volatility in the market.
When the median line and EMA are of same length, the difference between these 2 indicators create a cloud that varies from green (when the median line moves above the EMA) to purple (when the median line goes beneath the EMA), with upward and downward tends respectively; as price signals fluctuate within the market.
Thus, a purple cloud can be seen during a bearish trend, and a green cloud seen during a bullish trend.
2. Parameters and Calculations of Median Indicator
Generally, indicators are established by means of a set of calculative algorithms that determine opening and closing prices, as well as establish new high and low points as the price signal fluctuates. With the median indicator, the ATR multiplier is used to establish the ATR lengths above and beneath the median line.


Note that;
- The median length mainly shows the number of data points used by the indicator during calculations, and it has a default setting placed at 3.
- For ATR length, it shows the time frame used for calculating the ATR of the median, and it usually has default set at 14.
- The ATR multiplier is established by multiplying the value of the ATR with the bands formed, and it usually has default set at 2.
It is worth noting that the values in the formulae above can be adjusted in setting, to best fit the technique of the trader.
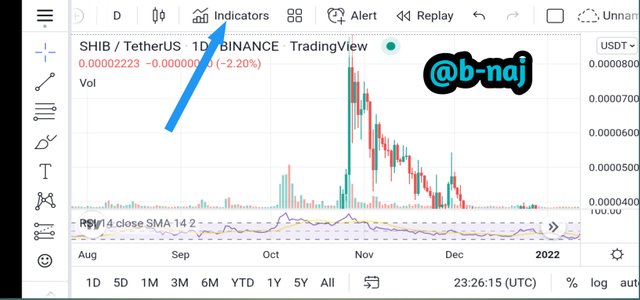
To add a Median Indicator to your chart, the following processes can be done as shown below.
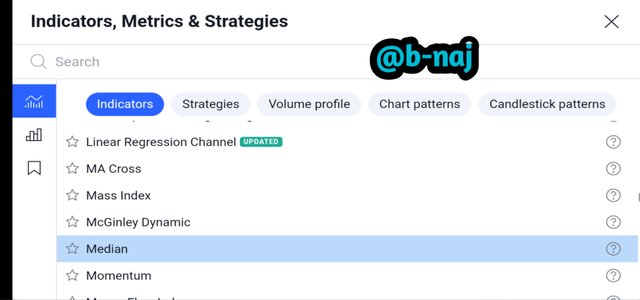
- Once you get to the chart, click on the Indicators option at the top, then chose the Median Indicator as shown below.
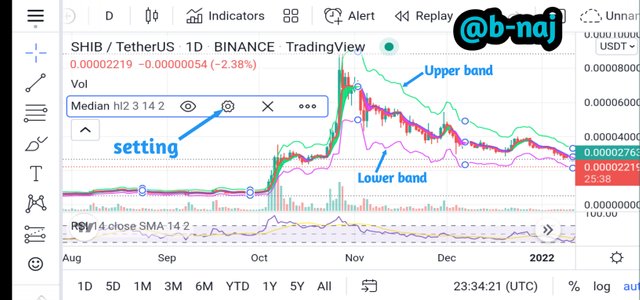
Now the Median indicator has been added to the chart. To edit the default settings on the indicator, simply click on the setting icon as shown below.
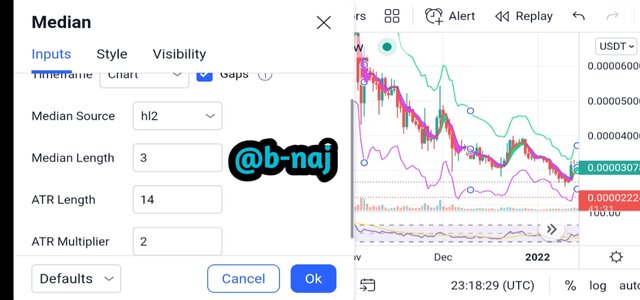
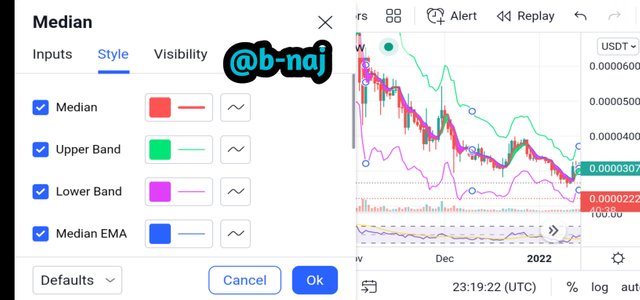
Screenshot gotten from Tradingview App Under Inputs the parametric values for the median indicator can be seen and edited to best suit the trader. The most significant and sensitive values are that of the ATR and Median length; as such, wrong values will result to defects as the signal readings won't be accurate expected.
Screenshot gotten from Tradingview App While the Style deals with the change in coloration to best suit the trader's taste. However, changes made here can't influence the accuracy and correctness of signal readings.
Screenshot gotten from Tradingview App
3. Uptrend from Median Indicator
It was already established that a cloud is seen between the difference of an EMA and the median line of the same length. For an upward trend to be witnessed, a cloud with green coloration must be seen being formed as the median line crosses to the top half of the EMA line to signify a bullish trend. As soon as this is detected, traders can open a buy entry position, and know when to close this said position.
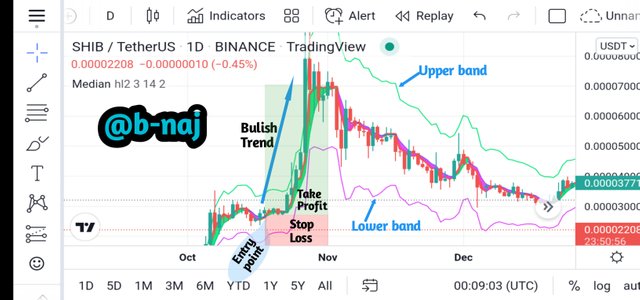
The SHIB/USDT chart above clearly shows the switch in cloud coloration from purple to green, signifying a bullish trend reversal (from bearish to bullish), as such, a buy entry was opened with Stop Loss and Take Profit zones created.
4. Downtrend from Median Indicator
For a downward trend, the cloud being formed here is purple in color as the median line crosses the EMA line to the bottom half, signifying a bearish trend. Once this observation is made, a trader can open a sell entry position, as well as know when best to close this said position.
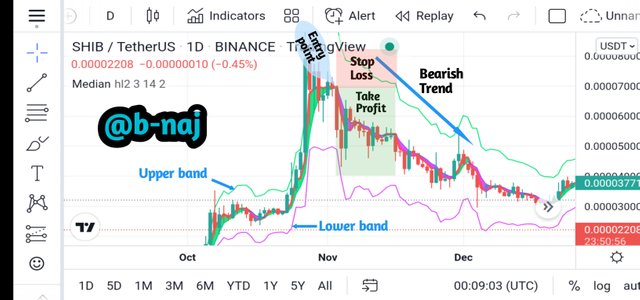
The SHIB/USDT chart above shows the sudden switch in cloud coloration from green to purple, signifying a bearish trend reversal (from bullish to bearish); as such, a sell entry is opened with Stop Loss and Take Profit zones created.
5. Identifying Fake signals with Median Indicator
Just like any other trading tool, the median indicator isn't correct always. It is common knowledge that all trend base indicators always follow the price signal line, just like the moving average indicators do. As such, it 8s advisable to combine other trading tools and/or trading strategies to this median indicator, so as to help sort out false price signals.
Fake Bullish Signals
Fake bullish signals can be seen when a bullish trend cloud (green) is seen to emerge just after a bearish trend, but the price signal is forced once more to move below the EMA line hereby contradicting the possible bullish reversal as illustrated below.
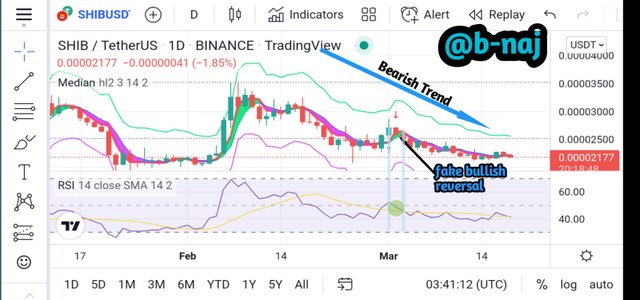
The SHIB/USDT chart above comprises of the median indicator, combined with the RSI indicator, to help sort out fake signals on the median indicator. On the chart, we see a fake bullish trend signal on the median indicator, and on the RSI we see that within that same period, the trend is a bearish continuity moving below the 50 mark along the 30 - 70 range of the RSI indicator. This helps prove that the momentary bullish trend was a fake signal, and it is advisable to patiently wait until both indicators have uniform signals before making an entry.
Fake Bearish Signals
Fake bearish signals can be seen when a bearish trend cloud (purple) is seen to emerge in the midst of a bullish trend, but the price signal is forced once more to move above the EMA line to observe a continuity in previous trend and contradicting the possible bearish reversal as illustrated below.
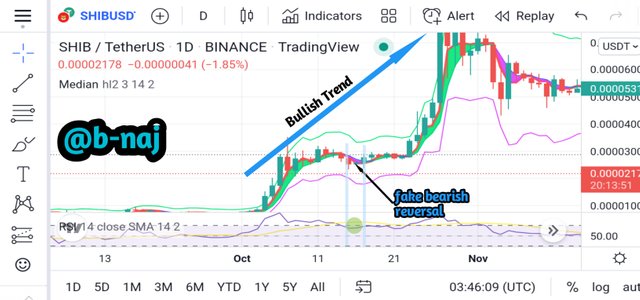
The SHIB/USDT chart above contains the combination of a median indicator and a RSI indicator, to help sort out fake signals shown by the median indicator. On this chart, a fake bearish trend signal can be seen on the median indicator, whereas on the RSI indicator, we see that the trend moves upwards (bullish continuity) so surpass the 60 mark along the 30 - 70 range on the RSI indicator. This helps prove that the momentary bearish trend was a fake signal, and it is advisable to patiently wait until both indicators have uniform signals before making an entry.
6. Opening a Demo Trade using the Median Indicator
ALL SCREENSHOTS USED WERE GOTTEN FROM THE TRADINGVIEW APP, UNLESS STATED OTHERWISE
CONCLUSION
Upon completion of this lesson taught by Professor @abdu.navi03, I have learnt and widened my knowledge on the following:
- What a median indicator is, and how to add it to a trading chart when implementing trading strategies.
- I learnt how to modify the values on which the median indicator works.
- Its signals in differing trends can be detected by a change in colors of cloud, with green representing a bullish trend, and purple representing a bearish trend.
- I practically learnt by carrying out demo trades why implementing what i learnt from this lesson.
- It is very important to know that there is no perfect trading tool or strategy, all we can try to do is reduce the chances of having wrong signals, via combining 2 or more trading tools and/or strategies.
Much thanks goes to Professor @abdu.navi03 for this awesome lesson.
Upvoted! Thank you for supporting witness @jswit.

I invite Professor @abdu.navi03 to this homework post