Steemit Crypto Academy Season 3 Week 2 - Homework post for @reminiscence01 by @azizulhassan
Hello everyone I hope that you are doing fine today I will try to to another homework task for the academy and I hope that you will learn something from my homework
Explain the Japanese Candlestick Chart? (Chart screenshot required)
Japanese candlestick chart let's start from the beginning this candlestick chart are called Japanese candlesticks because they are the kind of look like of Japanese candles if you look at the candles carefully that's why they are named after Japanese candlestick chart and the founder of these candlestick chart was a Japanese trader that is also one of the reason now These candlestick chart represent the price of assets now sometimes they go up and sometimes they go down as you all know how do they represent well mostly traders pick up their own colours but the normal in the default colour of the candlestick is green and red
red colour represents means that the price of certain assets it is going down and when there is green candles it means that the prices going up it means that people are buying and there are more buyers that's why the prices going up of the chart is completely made of the scandal and there are a few thing which this candle represents one each candle the present four things all time low at time hai where the market was closed where the market was opened you will find these four things in each tender and when we combine these things they form a Japanese candlestick chart

Describe any other two types of charts? (Screenshot required)
two types of charts
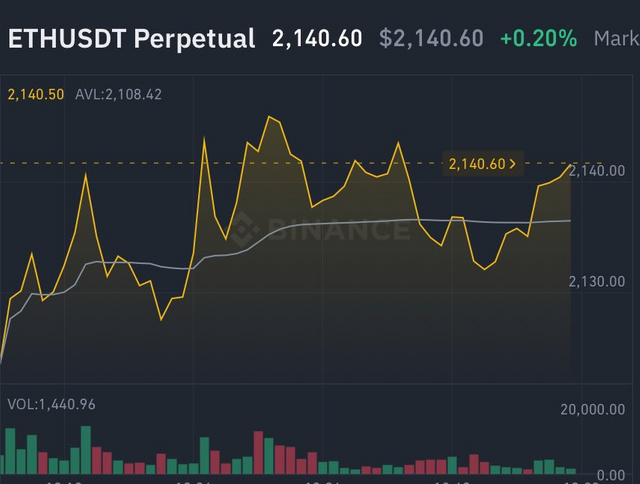
1 line chart
The first type of thought that I will try to explain it is called line chart this is the most famous and the most easy cards to read because there is nothing so complicated in it and mostly e people prefer this for the beginner threaded because these charges are very easy and you will find the charge on all the big exchanges for example in Crypto world binance you will get this chat so you can see that what's the movement of the price now as we all know that candlestick chart and other chart gives you more information about the prices when it comes to line chart only provide you with the closing price after market for a certain asset so this chat doesn't provide you that much information about the market that's why people don't give that much importance to this chat but yes when it comes to the performance I think this chat has its own place in the world of trading
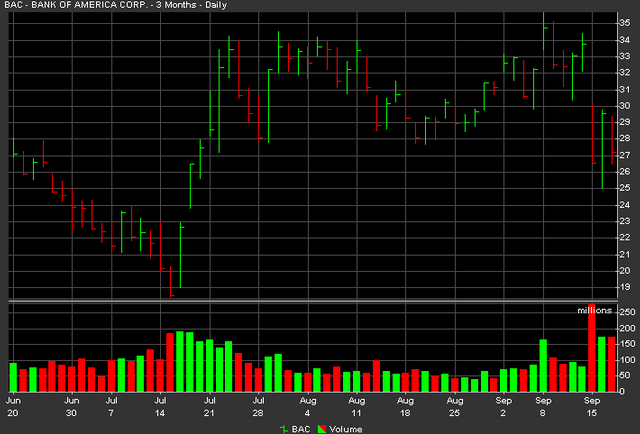
2 bar charts
Bar charts discharge also one of the kind and people really use this like mostly traders use this charts to understand the price movements these charts are very similar to the previous candlestick charts that kind of look the same but not entirely if you look carefully and the bar charts there is one handle to the right and there is one handle to the left and a straight line that is the shape of bar chart the straight line the upper point of the chart represent all time high and the lower point a present the all time low and then the above handle represent where the market was opened and the down handle the present where the market was closed there is only the difference of Shape in the candlestick chart and in the barchart otherwise both of them they do the same thing and they give the same information about the market and the price movements
In your own words, explain why the Japanese Candlestick chart is mostly used by traders.
Japanese candlestick charts are mostly used by trader because the chart of the most easiest 1 when it comes to the trading in formation and technical analysis mostly trader who is this charge because they get all the information what they need about the market very easily from these charts and as we all know that these charts contain the most and formation when it comes to the market pricing And these charts are widely available in all of the famous exchanges when it comes to cryptocurrency trading a person can do a technical analysis on the base of charts very easily with the candlestick charts
now if you look at the other charts they are kind of very complex and that don't give you much information about the market if you look at line chart they only provide the closing prices and if we look at the other charts they are for some other purposes but when it comes to Japanese candlestick charts they give you almost all the information and sometimes you don't even have to look at the complex and formation to see which trend is going on at that time in the market you can take a quick decision by just looking at the chat
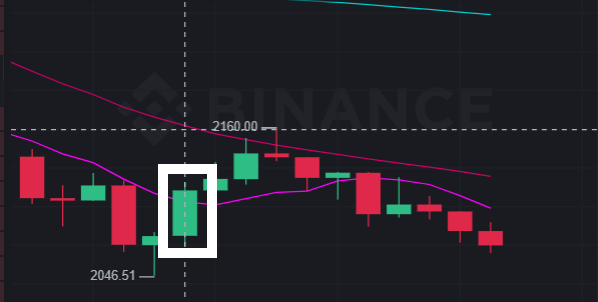
Describe a bullish candle and a bearish candle identifying its anatomy? (Screenshot is required)
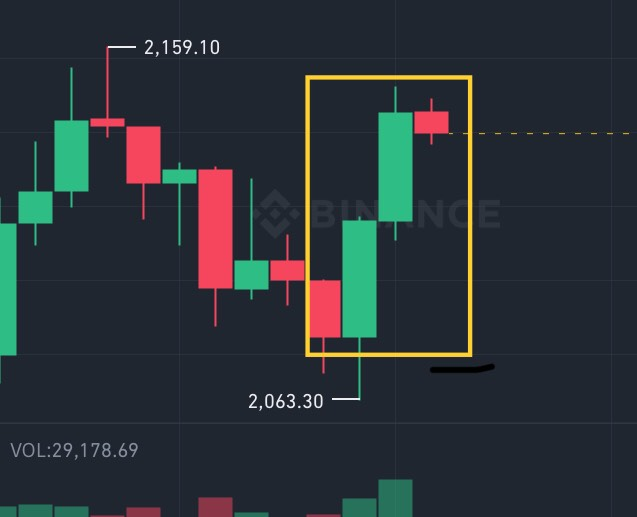
bullish candle
It is very easy to understand when the market is bullish and when the market is bearish using the Japanese candlestick charts now we will identify when the market is bullish and when the market is bearish first let's understand what bearish and bullish means where is means that the market is going down and bullish means that the market is going up now let's understand how can we identify that very easily if there are are so many green candles forming a shape of UP line it means that that is in uptrend and the market is is bullish at that time green candle means that there are more buyers in the market and the the demand is very high and that's why it is going up that's why there are more green candles in the most probability of market going up which is bullish
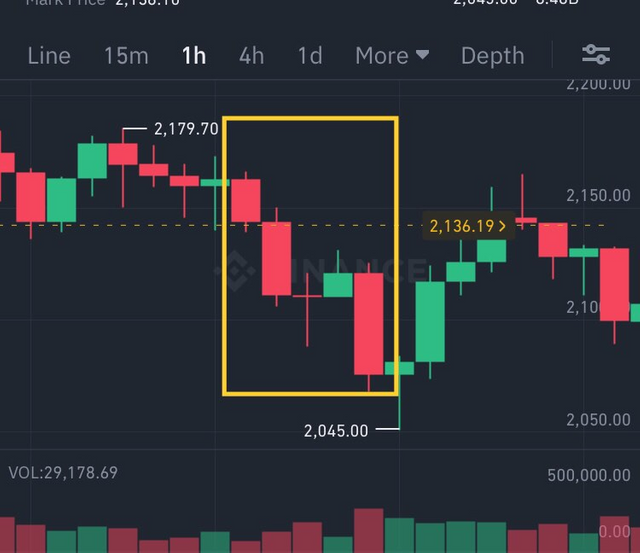
bearish candle
now we can apply the same Uri but reverse if there are more red candles and they are forming a shape line of down it means that the market is going down and there are more sellers in the market at that time and the demand is very low but the cell is very high which probably means that the market will go further more down and the market is bearish red candle identify the cells and mostly it is when the market is going down now you can change the colour according to your personal preference but the default colour is red and which means that the market is going down and it's a bearish market
thanks to the professor for teaching us
@reminiscence01
Hello @azizulhassan,I’m glad you participated in the 2nd week of the Beginner’s class at the Steemit Crypto Academy. Your grades in this task are as follows:
Recommendation / Feedback:
Thank you for participating in this homework task.