Ultimate oscillator indicator- Steemit Crypto Academy- S5W8-Homework post for @utsavsaxena11.
A very informative lecture on the Ultimate oscillator. I have learned that how it works and what is things that include in the calculation process. I have learned how to trade with this oscillator indicator. I try to explain this oscillator. I hope it will help you to understand this indicator.

What do you understand by ultimate oscillator indicator. How to calculate the ultimate oscillator value for a particular candle or time frame. Give a real example using chart pattern, show complete calculation with accurate result.
The Ultimate Oscillator is designed by the Mr. Larry William in 1976. In the beginning, it is designed for the stock market, but later on, it is featured to use in the crypto market. It is a momentum-based indicator. It is used to determine the market momentums over the three different time periods.
The other momentum-based indicator produces several divergence signals in advance. After producing signals, the market is still moving in the same direction. Traders are stuck in this scenario because other momentum indicators use signal time frames for calculation.
To solve this advance producing divergence or other signals often, the Ultimate Oscillator incorporates to the market. This indicator helps us to reduce the signal that is often and advanced. This is because it uses three different time frames to calculate the result. The main purpose of the Ultimate Oscillator is to avoid the Pitfall that is produced by another momentum indicator.
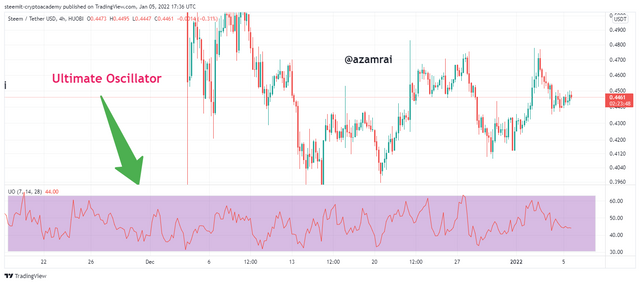
In the above figure, you can see what how Ultimate Oscillator looks like. It is working with three timeframes (7,14,28). It is oscillating between 0-100 considering the center as 50. It also produced the oversold and overbought of assets when the oscillating line cross the 30 and 70 lines on the indicator.

Calculation of Ultimate Oscillator
The Calculation of the Ultimate Oscillator is quite complex than other indicators. Because there are several entities included in the process of calculation. When we want to calculate the Ultimate Oscillator, then we need High, Low, and Closing of the period over a certain time period.
When we get these three values then, we will calculate the Buying Pressure. After calculating the buying pressure, we need to calculate the True Range. When we get these values, we need to calculate the Average Value of the previous 7 periods, 14 periods, and 28 periods. After that, we will put these values in the formula of indicator calculation. All the formulas of calculation are shown in the figure.
- We get the Average 7 values by dividing the sum of the previous 7-period buying pressure by the sum of 7 periods True Range.
- We get the Average 14 values by dividing the sum of the previous 14-period buying pressure by the sum of 14 periods True Range.
- We get the Average 28 values by dividing the sum of the previous 28 periods buying pressure by the sum of 28 periods True Range.
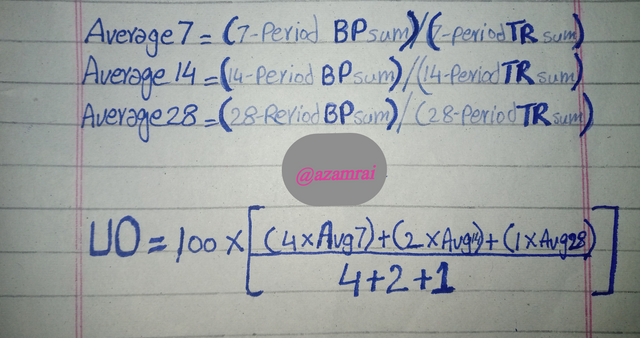
In the above figure, you can see the formula of all the Averages. You can see the formula of the Ultimate Oscillator.
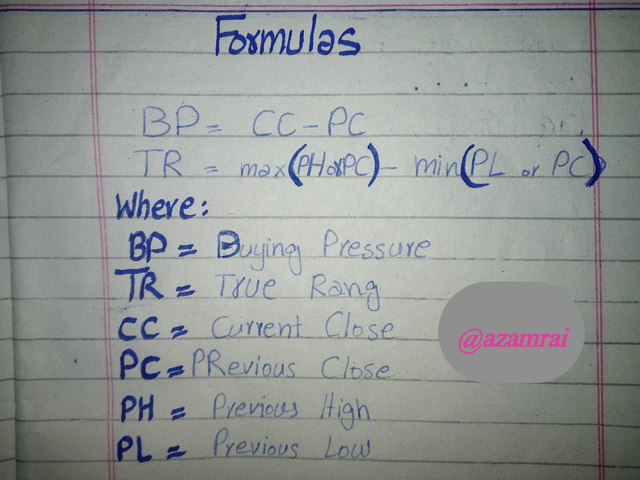
Before calculating the Averages, Buying Pressure, and True Rage I apply the formulas regarding every entity. Every formula is placed in the above cell of regarding entity. These formulas are working behind every entity calculation.
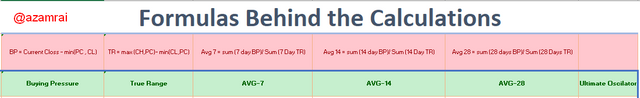
For a clear view, I mention here all the formulas.
- BP = Current Closs - min(PC , CL)
- TR = max (CH,PC)- min(CL,PC)
- Avg 7 = sum (7 day BP)/ Sum (7 Day TR)
- Avg 14 = sum (14 day BP)/ Sum (14 Day TR)
- Avg 28 = sum (28 days BP)/ Sum (28 Days TR)
I chose STEEM/USDT pair for calculating the current Ultimate Oscillator values. I open the chart and set the 1Day time period on the chart. In this way, I can easily calculate the values of periods. To calculate the current UO values, we need to previous 28 days' candle’s high, low, and closing date.
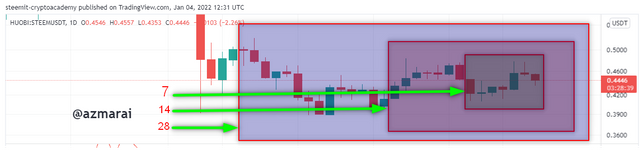
We can get this data directly from TradingView.com. But here is a problem. Those users who have paid subscriptions can get chart data in the form of an Excel file. The premium version is about $126 per year that everyone can’t afford.
So, I have no subscription to TradingView.com. I insert the previous 28 period’s (high, Low, and closing of every period) data manually in the Excel table. After putting values including date, I will put the formulation of Calculating the Buying Pressure that we discussed in the above section.
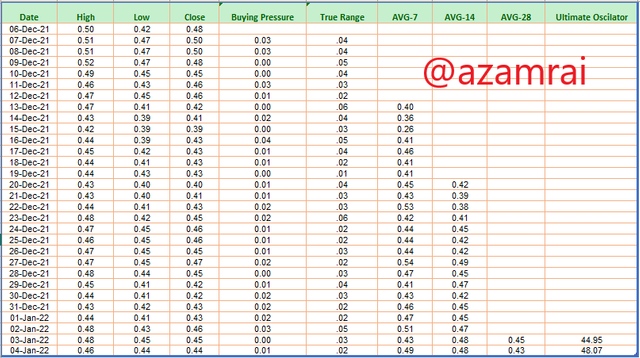
Next, I enter the formula of True Range. The formula is mentioned at the start of this question. After that, I apply the formula of 7-Period Average. In the same way, I apply the remaining two formulas of 14- Periods Average and 28-Periods Average.
In the end, I apply the formula of the final Ultimate Oscillator value in the last column of the table. You can see that all the values in the following table. The Values display in the table in two significant figures actually they are in 4 significant figures. It shows only two values after round the right digit.
Now we calculate the final value of the Ultimate Oscillator by putting the values of the last 7,14 and 28 days averages in the formula. We get the values above values by incorporating the formula and values in the above table.
Last 7 days Average = 0.49
Last 14 days Average = 0.48
Last 28 days Average = 0.43
Putting Values in Formula
UO= 100 x [ (4 x 7d Avg) + (2 x 14d Avg) + (1 x 28d Avg)] / 4+2+1
UO= 100 x [ (4 x 0.49) + (2 x 0.48) + (1 x 0.43)] / 4+2+1
UO= 100 x [ (1.96 + 0.96 + 0.43] / 7
UO= 100 x [ (1.96 + 0.96 + 0.43] / 7
UO= 100 x 3.35 / 7
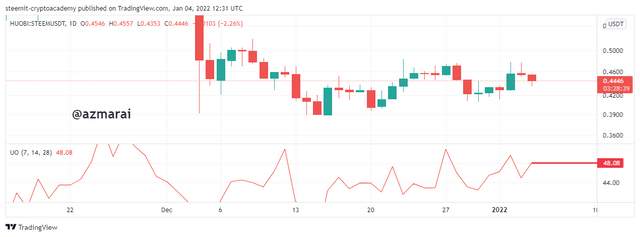
The final value of UO is 48.07 that I get after calculation. When the see at the current values of the Ultimate Oscillator on the bottom of the chart, it is 48.08. In this way, we can see that the value of the indicator is calculated.
How to identify trends in the market using ultimate oscillator.
As we discussed above the Ultimate oscillator is used to determine the current trend in the market. we can determine the trend by observing the movement of the Ultimate oscillator in a particular direction. The shows the results after calculating the values over three different time periods. That is why the result is accurate. There are types of trends that we determine by UO.
Identification of Uptrend:
When the price of an asset is moving upward direction and in the same way, the Ultimate Oscillator line is also moving in the same upward direction. When it is moving with the movement of price in the upward direction then we can say the market is on an Uptrend.
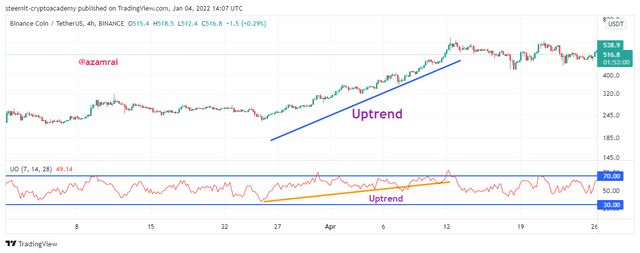
In the above figure, you can see that the market price and the indicator line is moving in an upward direction. The oscillator line is moving upward direction. We can notice that the price is also increasing with moving the UO line in an upward direction. In this way, we can determine the Uptrend using the Ultimate Oscillator.
Identification of Downtrend:
When the price of an asset is moving downward direction and in the same way, the Ultimate Oscillator line is also moving in the same downward direction. When it is moving with the movement of price in the downward direction then we can say the market is on a downtrend.
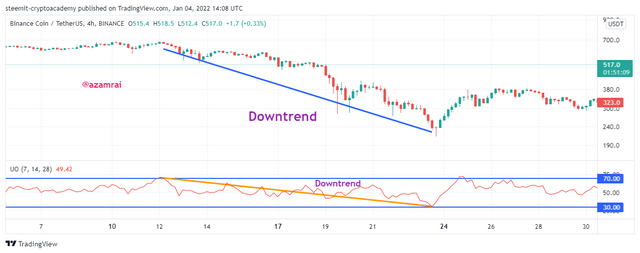
In the above figure, you can see that the market price and the indicator line is moving downward direction. The oscillator line is moving downward direction. We can notice that the price is also decreasing with moving the UO line in a downward direction. In this way, we can determine the downtrend using the Ultimate Oscillator.
What is the difference between the ultimate oscillator and slow stochastic oscillator?
The slow Stochastic indicator and Ultimate Oscillator both are momentum-based indicators. We can determine the signals by divergence. Both indicators are different from each other. The stochastic oscillator is calculated by considering the high, low, and closing prices over a certain time period.
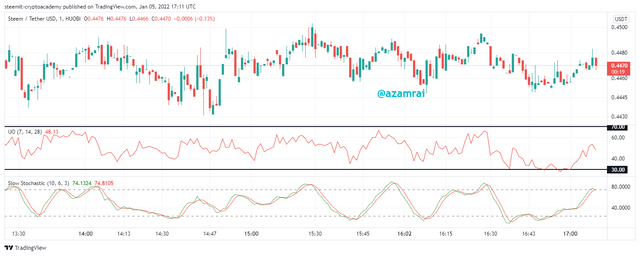
But the Ultimate Oscillating calculates its value by considering the high, low, closing, buying pressure, and true range over three different time frames. Slow Stochastic is calculating the values by setting the time between the 5-Day to 21-Days. On the other side, the Ultimate Oscillator calculates the values by setting the time frame mostly 7, 14, 28.
Both indicators are working within 0-100 points. But the overbought and oversold signals are different. The stochastic oscillator overbought signal is displayed when the line crosses the 80 levels. An oversold signal is displayed when the line crosses the 20 levels on the downside.
On contrary, the Ultimate oscillator overbought signal is produced when the line crosses the 70-line above side. An oversold signal is produced when the line crosses the 30-line downside.
How to identify divergence in the market using an ultimate oscillator, if we are unable to identify divergence easily then which indicator will help us to identify divergence in the market.
Divergence is a contradiction between the asset price movement and the indicator movement. When the price moves in one direction and the indicator moves in the opposite direction then it indicates the divergence in the indicator. We can identify two types of divergence one is bearish and the second is a bullish divergence.
Identification of Bearish Divergence:
When the price of an asset is moving in an upward direction and of the opposite way, the Ultimate Oscillator line is moving in the downward direction. In other words when the asset price makes higher highs and the indicator makes lower lows at the same time, then we can say that the indicator shows the bearish divergence.
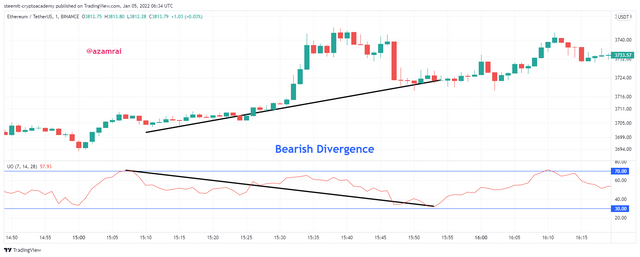
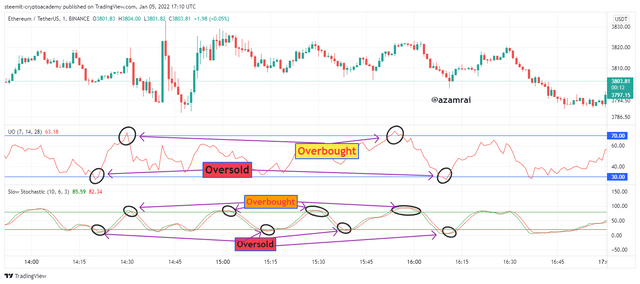
In the above figure, you can see that the market price and the indicator line is moving in opposite directions. The market price makes higher highs and the indicator makes lower lows. You can see that the market price is at a low point and the indicator shows that the asset is in the overbought region. In the same way at the end of divergence the market price at its peak and the indicator line at the oversold region. This shows that the bearish divergence.
Identification of Bullish Divergence:
When the price of an asset is moving downward direction and in the Ultimate Oscillator line is moving in the upward direction. In other words when the asset price makes lower lows and the indicator makes higher highs at the same time, then we can say that the indicator shows the Bullish divergence.
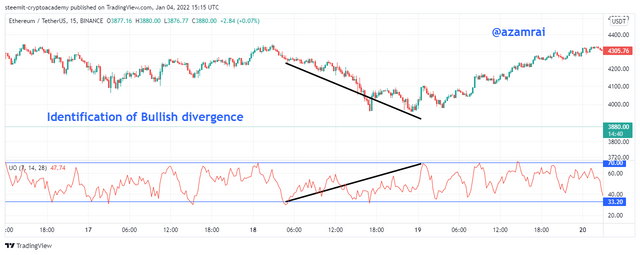
In the above figure, you can see that the market price and the indicator line is moving in opposite directions. The market price makes lower lows and the indicator makes higher highs. You can see that the market price at the highest point and indicator shows that the asset is in the oversold region. In the same way at the end of divergence, the market price is at its lowest value, and the indicator line indicates the overbought region. This shows that the Bullish divergence.
If we are unable to identify divergence easily then which indicator will help us to identify divergence in the market.
There are several momentum indicators that help us to identify the divergence in the market. The indicator that helps us to identify the divergence is Money Flow Index, RSI, Awesome Indicator, Stochastic Indicator, and OBV indicator. If we face difficulties to find the divergence using the Ultimate Oscillator then we can use the above indicators to determine the divergence in the market.
In this question, we will how to identify the divergence using one oscillator among the ones mentioned above. There are two major and most used indicators for identifying the divergence are RSI and Stochastic indicator.
I personally prefer to determine the divergence using the RSI indicator. We can easily find the divergence using RSI. When Price makes a higher high and RSI makes Higher Lows then we can say that the RSI shows the bearish divergence.
When price makes lower lows and RSI shows the higher highs then the RSI shows the bullish divergence. These bullish and bearish divergences indicate that the current trend is about to change.
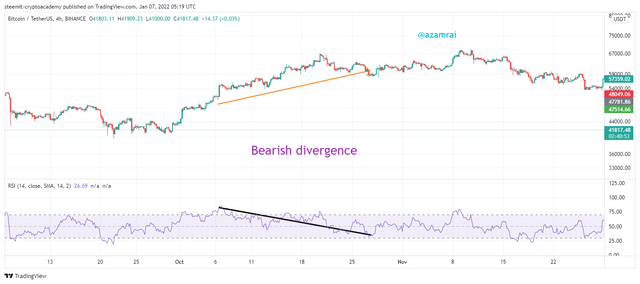
In the above, figure, I mention one types of divergence that we can identify using RSI instead of using the Ultimate oscillator. In this, you can see that the price makes higher highs and RSI makes higher lows. This indicates the bearish divergence. Indicating that the current bullish trend is going to change.
We want to get good and accurate results from divergence then, we need to use the chart for a longer time frame like 4 hours. In this way, we can identify the divergence if we face difficulty in finding the divergence with the ultimate oscillator.
what is the 3 step- approach method through which one can make entry and exit from the market. Show real examples of entry and exit from the market.
When we are using the Ultimate oscillator for trading, there are three rules taken into count for taking an entry and exit from the market. If these rules are satisfied then we are able to take an entry to the market. We will discuss both trade rules.
Buy Signal:
When we place a buy trade then we need to wait until the following steps or approaches are satisfied.
- The very first rule is to satisfy the bullish divergence in the indicator in which the price makes lower lows and the indicator makes higher highs.
- The indicator should start from the oversold region that is 30 and move in an upward direction.
- The indicator should go above the divergence high point. The Divergence highs are the two lows between the divergence.
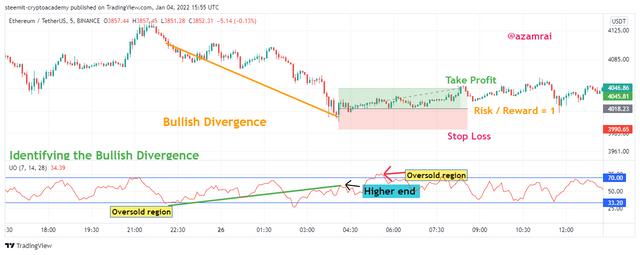
In the above figure, you can see that all the conditions are satisfied. You can see that the indicator shows the divergence with price. Next, the start of the divergence point is from the oversold region and indicator moving upward direction. Next. You can see that the indicator rises above the divergence high. After fulfilling all the conditions, I place a buy order at this place with proper risk management. Stop loss and take profit are set. The Risk and reward ratio is also set.
Sell Signal:
When we place sell trade then we need to wait until the following steps or approaches are satisfied.
- The very first rules are to satisfy the bearish divergence in indicator in which the price makes higher highs and the indicator makes lower lows.
- The indicator should start from the overbought region that is 70 and move in a downward direction.
- The indicator should go below the divergence low point. The Divergence low point is the two high between the divergence.
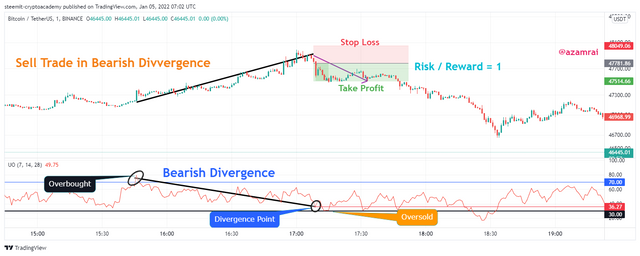
In the above figure, you can see that all the conditions are satisfied. You can see that the indicator shows the divergence with price. Next, the start of the divergence point is from the overbought region and indicator moving downward direction. Next. You can see that the indicator go blow the divergence low. After fulfilling all the conditions, I place a sell order at this place with proper risk management. Stop loss and take profit are set. The Risk and reward ratio is also set.
What is your opinion about the ultimate oscillator indicator. Which time frame will you prefer how to use the ultimate oscillator and why?
The ultimate oscillator is a good indicator for doing technical analyses. It helps us to determine the current trend in the market. We use this indicator for getting the buying and selling signals when the indicator crosses the 70 levels on the above side and crosses the 30 levels on the bottom side.
I really like this indicator because this indicator does not produce very often signals like other indicators. It produces a signal after calculating the buying pressure, true range, and taking averages of the last 7,14 and 28 periods. It uses three different period results for the calculation. That is the result produced by this indicator is more accurate than another indicator.
Which time frame will you prefer how to use the ultimate oscillator and why?
The time frame setting depends on the volatility of assets and our trading strategy. The default time frame is 7,14 and 28 periods. When the volatility of selected assets is high then I prefer the default time frame that is 7, 14, 28. If the Volatility of the asset is low and it does not produce the buy and sell signal by crossing the upper 70 levels and lower 30 levels, then the new need to increase the sensitivity of the indicator by decreasing the time frame.
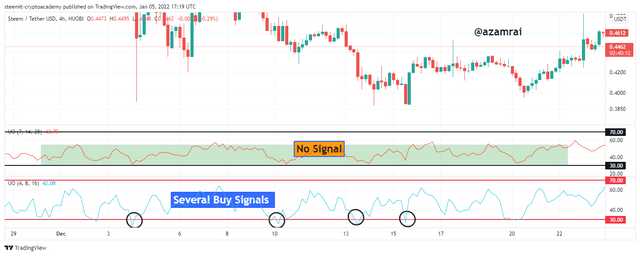
I like the default time frame (7,14,28)when I select the asset that has high volatility. Because it produces a signal as usual. When I select the asset, whose volatility is low then I change the time frame and increase the sensitivity of the indicator. I increase the sensitivity of indicators by decreasing the number of periods.
I set the time frame of indicator (4,8,16). When I increase the sensitivity of the indicator then it produces the signal in the same order as high volatility asset produced on default time frame.
The ultimate indicator is a momentum-based indicator. It is developed for multiple purposes. It is used to determine the current trend in the market. We can do trading by determining the buy and sell signals through this indicator. It is not produced often signals like other indicators.
The calculation of this indicator is a bit complex with respect to other indicators. The things that are involved in calculation are high, low, close, buy pressure, and true range over 7, 14, and 28 periods. We get the result by putting all the values in the formula.
We can also do trading with determining the divergence in the market. when divergence is shown by indicator, it indicates that the trend is about to change. We can use divergence for placing the buy and sell order in the market.